
Banque de France Bulletin no. 216: Article 2 Investment funds in the euro area: an uneven dynamic since 2009
Non-money market collective investment undertakings (investment funds) are highly dynamic: outstanding amounts under management have more than doubled in value since 2009 to just over EUR 11,000 billion at the end of 2017 – an amount equivalent to the gross domestic product (GDP) of the euro area. This overall dynamism disguises pronounced differences between countries, with Ireland and Luxembourg reporting the most substantial growth. In addition, breakdowns between fund types and the categories of underlying investments also vary depending on the euro area country, as does the profile of the investors (financial or non-financial) who subscribe to the funds. This study compares the aggregated balance sheet data for nine major euro area countries.
Dynamic but uneven growth in investment funds in the euro area since 2009
A sustained growth rate
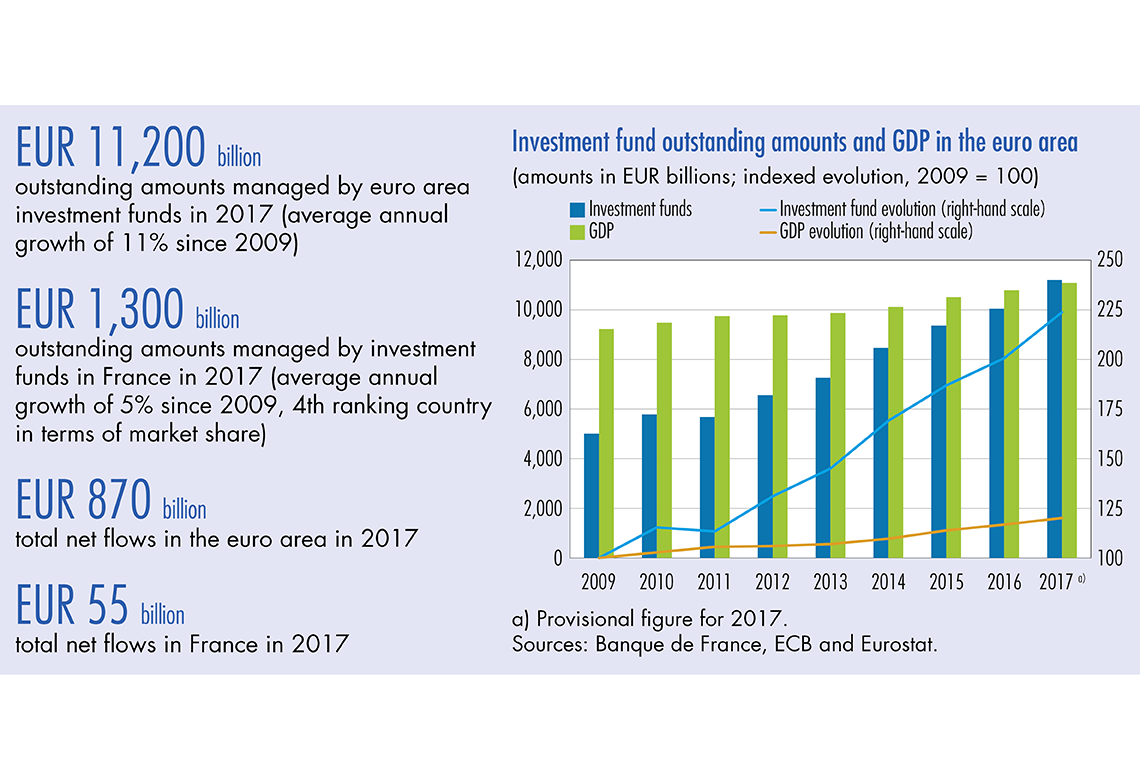
The value of outstanding amounts managed by non‑money market investment funds1 has more than doubled in the euro area since 2009, increasing at an annual average rate of 11% during the period. It came to just over EUR 11,000 billion in December 2017 – an amount equivalent to the gross domestic product (GDP) of the euro area (see Chart 1).
The sums placed in these funds are invested in a variety of products, such as equity, debt securities and real estate assets. Even though their investment policy tends to target a particular asset class, investment funds enable subscribers to diversify their risk. A wide range of investors, including banks, insurance undertakings, non-financial corporations, general government and households, are attracted by these funds because of the broad variety of investment possibilities available, with different risk and yield profiles. As a result of the diversity of investors on the one hand, and the considerable amounts involved on the other, these funds play a major role in financial intermediation.
Very strong growth in Luxembourg and Ireland
Four countries (Luxembourg, Germany, Ireland and France) account for 80% of total euro area outstanding amounts (see Chart 2). The remaining 20% is broken down among fifteen other countries.2,3 The average annual growth rate of investment funds varies from 4% to 20% (see Table 1) depending on the country. The funds located in Luxembourg and Ireland are particularly significant in terms of outstanding amounts (EUR 3,900 billion and EUR 1,900 billion, respectively, at end-December 2017), and report very robust annual growth rates of 12% and 20%. Their euro area market share has also increased since December 2009 by 4 percentage points and 8 percentage points, respectively, at the expense of all the other euro area countries. France, with an average annual growth rate of 5%, recorded the greatest decrease in market share, slipping from 18% in 2009 to 12% in 2017.
Variable concentration levels from country to country
In December 2016, the average outstanding amounts under management by euro area funds had almost doubled to EUR 216 million since December 2009 (EUR 111 million) – see Chart 3. Over the same period, the number of funds remained relatively stable, up only 12%, for a total of 52,000 funds. Concentration levels differ significantly from country to country.
Download the PDF version of this document
- Published on 05/22/2018
- EN
- PDF (399.02 KB)
Banque de France Bulletin 216
Updated on: 10/30/2019 18:44