Working Paper Series no. 869: Forecasting Inflation in France: an Update of MAPI
In this paper, we present an updated version of the reference model used at Banque de France to forecast inflation: MAPI (Model for Analysis and Projection of Inflation). While the conceptual framework of the model remains very close to its initial version, our update takes stock of three different factors. First, since the previous version of the model, the underlying nomenclature used at the European level (ECOICOP) to define some of the main aggregates was changed, therefore requiring a careful review of the relevance of initial equations. Second, in the context of the modification in 2019 of the main semi-structural macroeconomic model used for the macroeconomic projections at Banque de France (FR-BDF), it aims at harmonizing the iterations between MAPI and FR-BDF. Finally, large variations in the wage variables in the midst of the sanitary measures related to the Covid-19 pandemics pushed us to use different concepts of wage and compensation variables. At the crossroads of these considerations, we update the model extending the estimation window, correcting specifications and input variables whenever relevant. The resulting model is an up-to-date, simplified and more parsimonious version of the initial model, entailing a stronger harmonization with the central macroeconomic model FR-BDF. It still involves significant pass-through of wages, oil and exchange rate to HICP.
This paper presents a renovated version of the main model used at Banque de France to forecast inflation: MAPI (Model for Analysis and Projection of Inflation). This model was first developed and described in 2017 (De Charsonville & al., 2017), but was gradually modified due to several factors: (i) a change in the European classification used to define HICP aggregates, operated in 2019; (ii) the necessity to strengthen the links between MAPI and the new semi-structural macroeconomic model used at Banque de France (FR-BDF), developed in 2019; (iii) important variations in input data, especially regarding wage and compensation dat, in the midst of the Covid-19 pandemic.
Inflation forecasts at Banque de France are produced within the Eurosystem framework, which requires both monthly and quarterly projections at the disaggregated level. MAPI meets these requirements by gathering a set of disaggregated equations for 12 components, mostly relying on Error Correction Models. More specifically, out of the 12 components we forecast, 7 of them (representing 87% of the HICP basket) are forecasted using Error Correction Models or Autoregressive equations.
Compared to the initial version of MAPI, the updated version relies on the same theoretical framework (i.e. consumer prices are expected to depend in the long run on domestic factors – wages and compensations – and import prices), and the same technical features (regarding the treatment of seasonality or the aggregates considered), but proposes improvements along three dimensions. First, we update the estimating samples up to 2019. Second, we simplify the estimation process by including only input variables that are forecasted within FR-BDF or that are part of Eurosystem assumptions. Finally, we develop equations that are more parsimonious, relying on milder assumptions.
This updated version of MAPI still entails a significant pass-through of the input variables to consumer prices as (i) a 1% permanent shock on wages leads to an increase of 0.3 percentage point (p. p.) of HICP in the long run; (ii) a 10 euros increase in the price of the Brent barrel increases HICP by about 0.2 p. p. for an initial Brent barrel price of 55 euros: (iii) a 10% appreciation of the euro against all other currencies decreases total HICP by 0.3 pp.
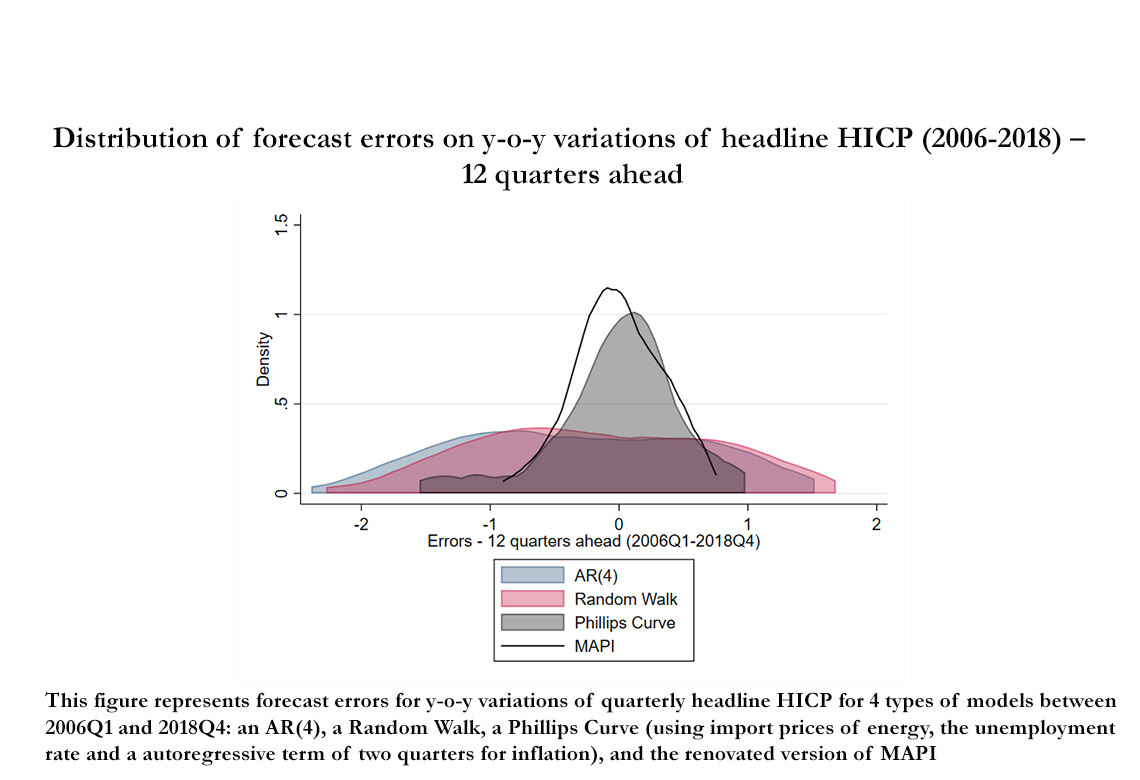
The paper also compares the in-sample predictive performance of the updated version of MAPI to three benchmark models: an AR(4), a Random Walk and a Phillips Curve using the unemployment rate, import prices of energy and an autoregressive term for inflation. We find that MAPI systematically outperforms these models for headline HICP (Figure 1). For HICP excluding food and energy, it outperforms AR(4) and the Random Walk, and has a predictive performance similar to that of the Phillips Curve.
Download the PDF version of this document

- Published on 03/31/2022
- 33 pages
- EN
- PDF (1.82 MB)
Updated on: 03/31/2022 09:24
