
Working Paper Series no. 878: New Facts on Consumer Price Rigidity in the Euro Area
Using CPI micro data for 11 euro area countries covering about 60% of the euro area consumption basket over the period 2010-2019, we document new findings on consumer price rigidity in the euro area: (i) each month on average 12.3% of prices change (vs 19.3% in the United States); when we exclude price changes due to sales, this proportion drops to 8.5% in the euro area vs. 10% in the United States; (ii) differences in price rigidity are rather limited across countries but much larger across sectors; (iii) the median price increase (resp. decrease) is 9.6% (13%) and 6.7% (8.7%) when excluding sales; (iv) the distribution of price changes is highly dispersed: 14\% of price changes in absolute values are lower than 2% whereas 10% are above 20%; (v) the overall frequency of price changes does not change much with inflation and does not react much to aggregate shocks; (vi) changes in inflation are mostly driven by movements in the overall size; when decomposing the overall size, changes in the share of price increases among all changes matter more than movements in the size of price increases or the size of price decreases. These findings are consistent with the predictions of a menu cost model in a low inflation environment where idiosyncratic shocks are a more relevant driver of price adjustment than aggregate shocks.
Inflation results from the aggregation of millions of individual firms' price adjustments. How often and to what extent firms adjust prices is of critical importance for the transmission of monetary policy.
This paper documents new evidence on the adjustment of consumer prices at the micro level in the euro area. To do this, we use country micro price datasets provided by the national statistics institutes (NSIs) of euro area countries, including millions of individual price trajectories collected for the construction of national HICPs. Data are available for 11 countries (Austria, Belgium, France, Germany, Greece, Italy, Latvia, Lithuania, Luxembourg, Slovakia and Spain). The time periods covered by the national datasets differ somewhat from one country to another but most national datasets cover the period 2010 to 2019. Overall, our datasets consist of about 135 million monthly price observations. Due to confidentiality restrictions, the analysis of these datasets were conducted in a decentralised way at the country level but following a harmonised methodology and using a common sample of products of 166 products at the COICOP-5 level, covering 59% of the total euro area HICP and 65% of the HICP excluding energy products.
Our main findings are as follows. In a given month, on average 12.3% of prices change in the euro area. When we exclude price changes due to sales, the frequency is reduced to 8.5%. Moreover, if we take price changes due to product replacements into account, the overall frequency of price changes is 13.6% and 9.8% when we exclude price changes due to sales. Country differences in our results are relatively small whereas sectoral heterogeneity is much more pronounced. The highest frequency of price changes is found for unprocessed food (31%) whereas the lowest frequency of price changes (6%) is found for services. When price changes due to sales are excluded, however, sectoral heterogeneity declines. The cross sectoral heterogeneity is highly similar across countries and can partly be explained by the cost structure of products. In particular, the share of labour costs has a negative effect on the frequency whereas the share of energy and raw material inputs has a positive effect.
Based on all price changes including those due to sales, we find that prices are more frequently updated in the United States than in the euro area. The average frequency of price change is 19.3% in the United States (vs 12.3% in the euro area). However, when price changes due to sales are excluded, the difference in the frequencies of price changes is significantly reduced (10% in the United States and 8.5% in the euro area).
Regarding the size of price changes, we find that the typical price change is quite large: the median price increase equals 9.6% whereas the median price decrease amounts to 13% (in absolute value terms). This pattern is quite common to all euro area countries even though cross country heterogeneity is more pronounced for the size than for the frequency of price changes. Across sectors, the median price change is smaller for services than for other products. When price changes due to sales are excluded, the median price decrease and increase are lower (amounting to roughly 7% for price increases and, depending on the way we define sales, between 9% and 11% for price decreases). We also provide new results on the full distribution of the size of price changes: in particular, we find that when sales are excluded, 14% of price changes are below 2% in absolute values whereas 10% of price changes are above 20% in absolute value terms.
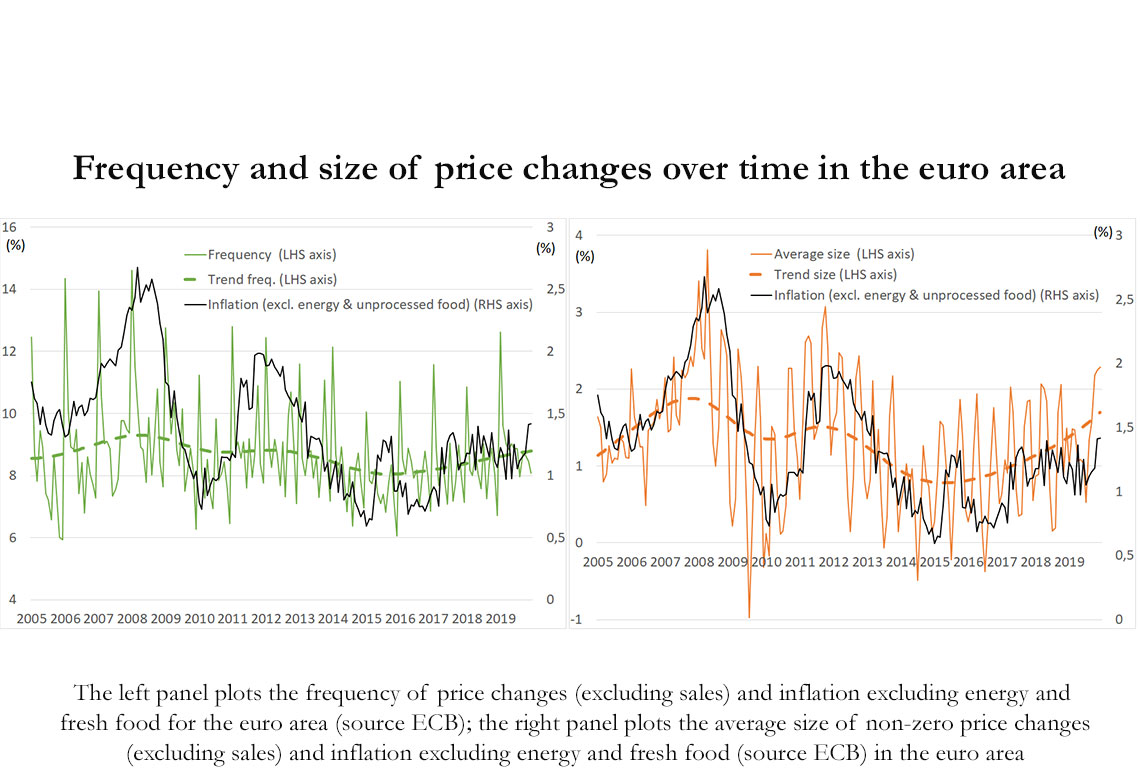
We also investigate how patterns of price adjustment have evolved from 2005 to 2019 and how they have contributed to inflation dynamics in the euro area. We find that the overall size of (non-zero) price changes contributes a lot to changes in inflation over time, while the contribution of the overall frequency of price changes is much smaller (Figure A). Finally, we investigate how several aggregate shocks (i.e. monetary, oil supply, demand, VAT and unemployment shocks) are transmitted to prices; we find that price setters respond to shocks by adjusting the overall size rather than the overall frequency of price changes. Besides, the relative share of price increases/decreases mainly drives the response of the overall size of price changes as opposed to the size of price increases and the size of price decreases. These findings are consistent with the predictions of a menu cost model in a low inflation environment and with large idiosyncratic shocks.
Download the PDF version of this document
- Published on 07/06/2022
- 113 pages
- EN
- PDF (3.94 MB)
Updated on: 07/06/2022 16:42