Although energy prices were supported by a number of temporary factors at the start of the year (rises in regulated gas and electricity prices in January and February, impact of the strikes in March on distribution margins and
oil-related product prices), the drop in the energy component of the HICP was confirmed in May, reflecting the decline in oil prices. Food inflation also appears to have started to moderate in May – from its previous high rates which were fuelled by sharp growth in producer prices up to early 2023 and their pass-through to final prices at the end of February following commercial talks over major national food brands. Year-on-year growth in manufactured goods prices has also been easing for several months, reflecting smaller rises in producer prices since the end of 2022. However, after remaining stable at 3.6% year-on-year from October 2022 to January 2023, services inflation edged up to 4.0% in May 2023, fuelled notably by wage rises.
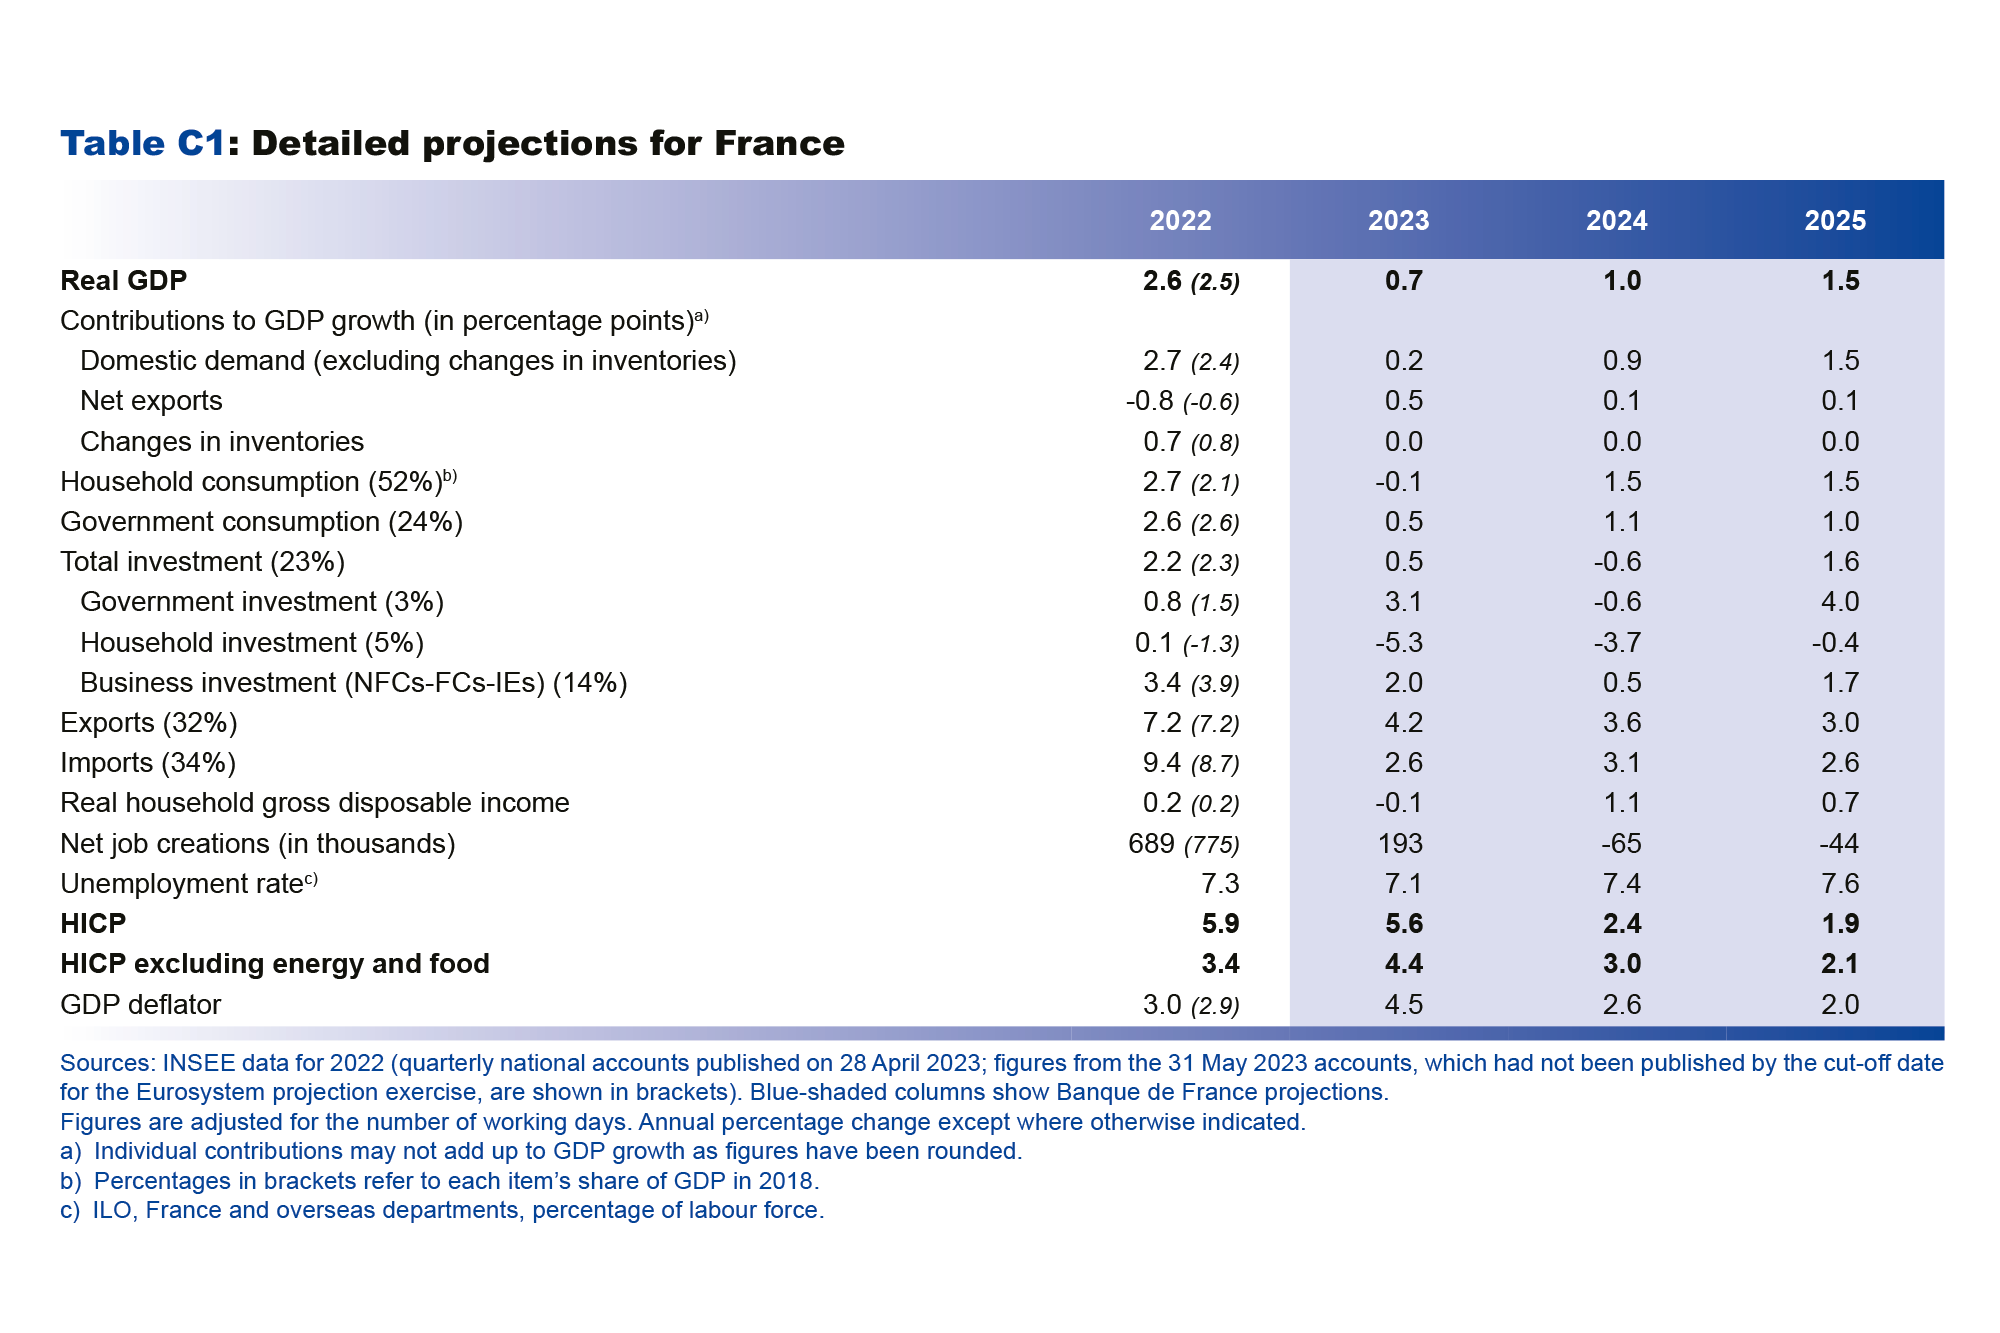
Over 2023, in the absence of any further shocks, headline inflation is predicted to recede markedly, essentially in the second half of the year. In annual average terms, it should come out at 5.6%, while inflation excluding energy and food is expected to be 4.4%. In the fourth quarter of 2023, headline HICP inflation and HICP inflation excluding energy and food should both be around 4.0% year-on-year. This marked fall in the headline inflation reading in the second half of 2023 masks contrasting trends in the index components as relative prices adjust.
Retail energy prices are projected to fall steeply in 2023, tracking international wholesale prices which began to retreat in the fourth quarter of 2022 – especially those of oil and gas. Based on European gas futures prices, which have come back to their summer 2021 level, final household prices are not expected to rise significantly in the second half of 2023 after the abolition of regulated prices in July. At the same time, electricity inflation should continue to be kept in check by the extension of the price shield until 2025, a measure announced by the government at the end of April.
Although we expect food inflation to prove stickier, it should then fall back sharply in the second half, reflecting the easing of agricultural input prices (food commodities as well as agricultural production costs). Nonetheless, this does not mean that we anticipate a fall in the level of food prices: historically, rises in food commodity prices are passed through partially to final prices, while falls cause final prices to stop rising but not to actually decline.
Manufactured goods inflation is projected to moderate more rapidly – as of the fourth quarter of 2023 – reflecting marked year-on-year drops in industrial producer prices as of the fourth quarter of 2022 linked to steep falls in import prices.
In contrast, services inflation is expected to remain stickier owing to persistent wage pressures, especially with the upward revision of the SMIC (minimum wage) and rises in industry-level negotiated wages. The upward pressures should also be exacerbated by the expected recovery in profit margins in some sectors to close to their long-term average. As a result, services inflation is not projected to slow before the start of 2024.
In 2024, with the easing of energy and food commodity prices currently factored in by futures markets, all components of inflation should fall. The main driver of inflation should then be services prices (see Chart 5), which are expected to continue being supported – albeit to a gradually diminishing extent – by delayed hikes in wages and rents and the ongoing margin recovery expected in some sub-sectors. In annual average terms, headline inflation is seen falling to 2.4%, while inflation excluding energy and food should recede more slowly to 3.0%.
In 2025, headline inflation and inflation excluding energy and food should continue to decline, reaching 1.9% and 2.1% respectively in annual average terms. This reflects the dual impact of the ongoing normalisation of commodity prices (energy and food) and the gradual transmission of monetary policy tightening to core inflation. Services inflation in particular should start to slow, reflecting smaller nominal wage increases than in previous years, although real wages are forecast to remain fairly dynamic thanks to the moderation in headline inflation
(see table page 7, “Change in real wages”).
After being supported by fiscal measures in 2022, household purchasing power should gradually be lifted by real wage growth against a backdrop of resilient employment
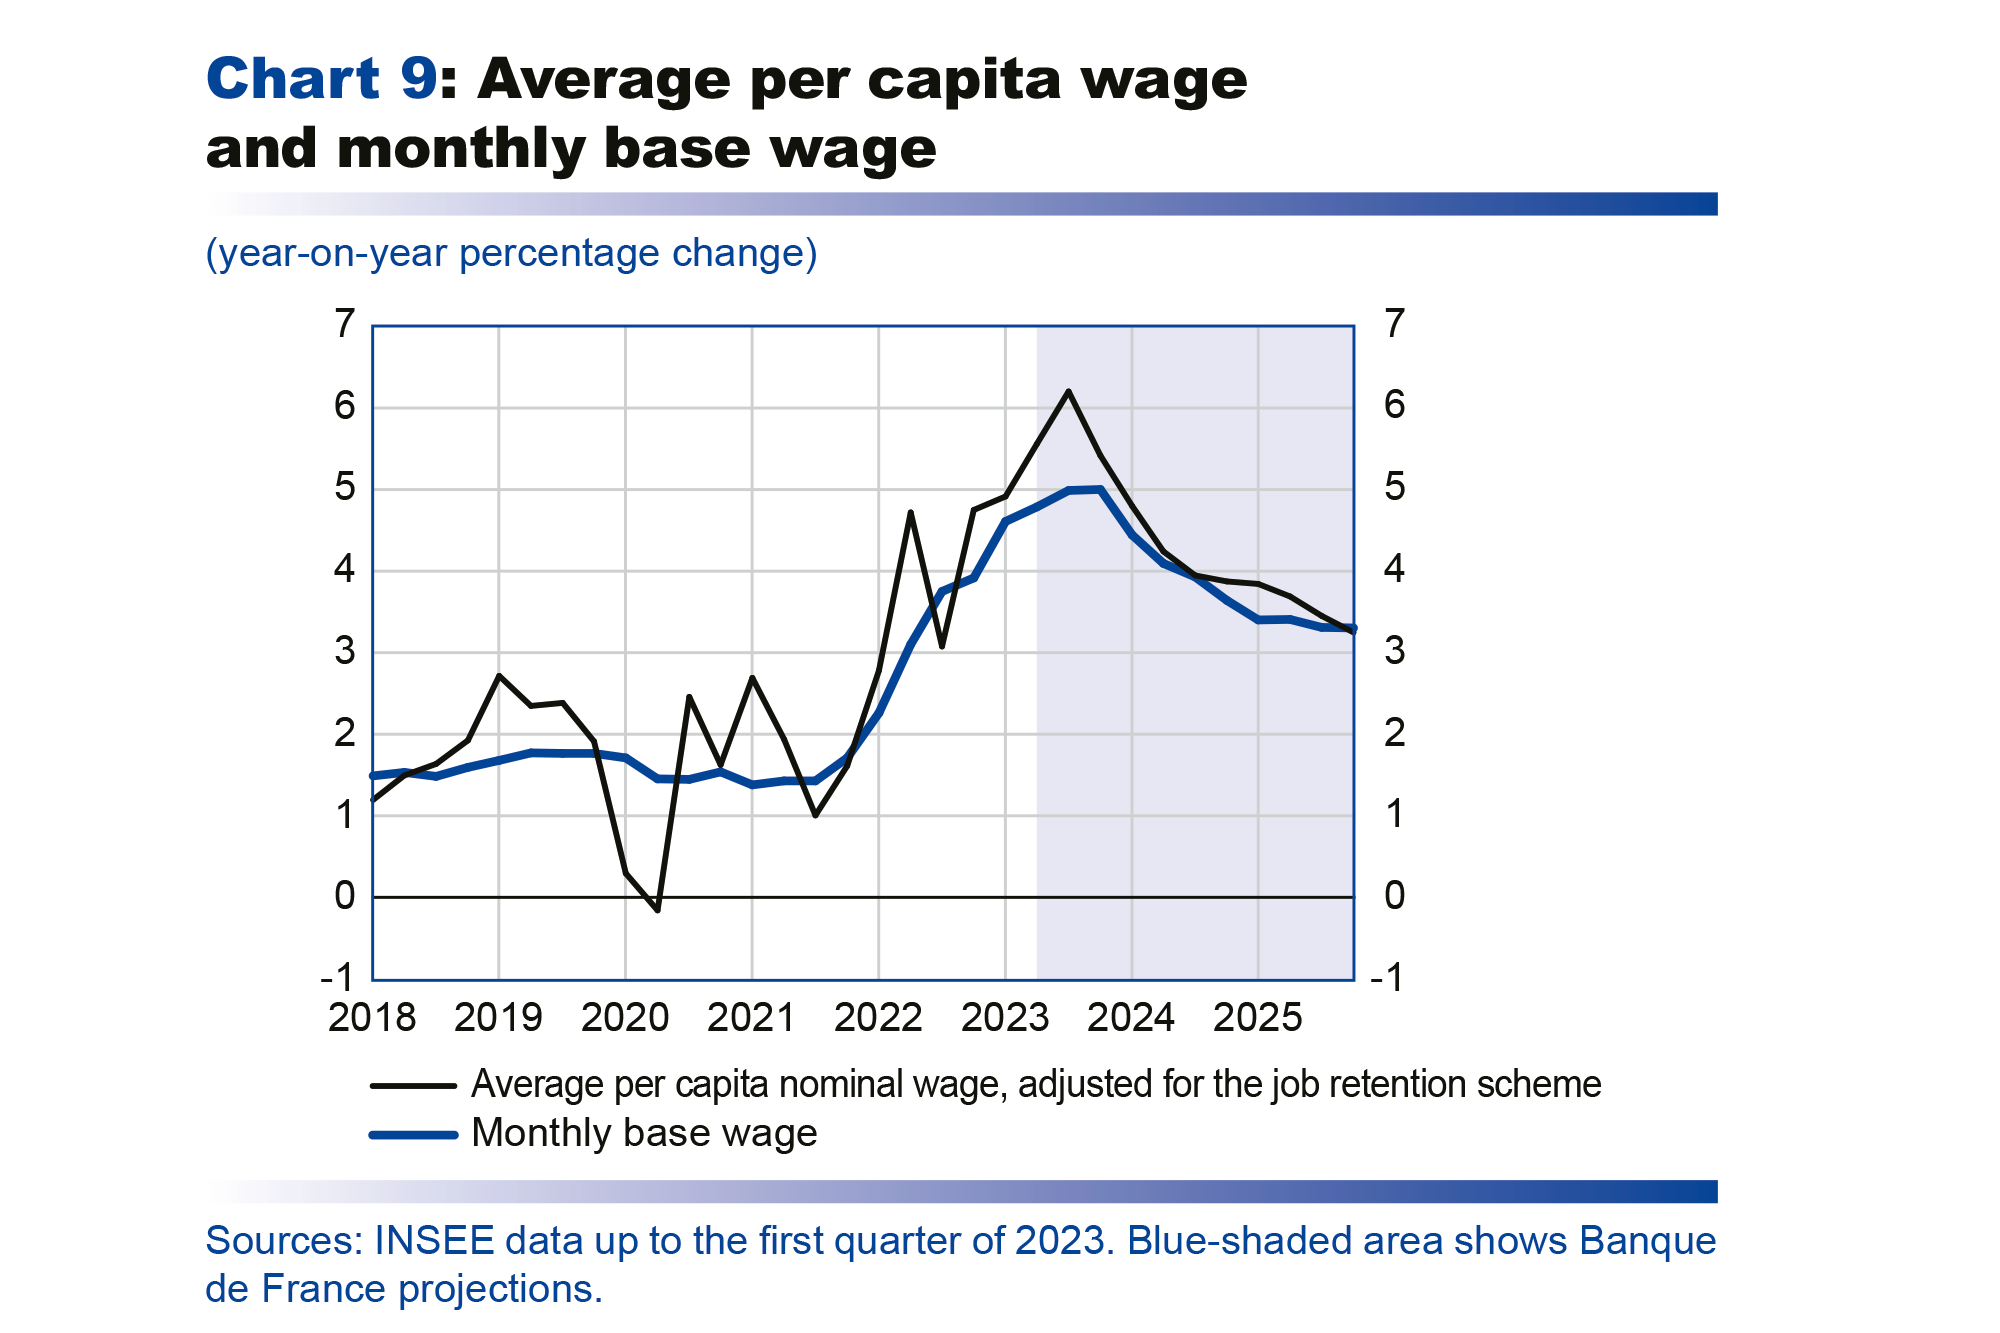
Purchasing power per capita, or real gross disposable income per capita, stagnated in 2022 (fall of 0.1%) and is expected to decline by 0.4% in 2023. The impact of the inflation shock on average purchasing power should be cushioned by a number of factors (see Chart 6). First, adjusted for the job retention scheme, the average wage per capita is expected to rise by 5.5% in 2023 compared with 3.8% growth in 2022. Second, strong employment growth, which provided marked support for purchasing power in 2022, should continue to make a slightly positive contribution in 2023. Finally, the fiscal measures and price shield should continue to support purchasing power, albeit to a lesser extent than in 2022. It is important to stress, however, that these macroeconomic forecasts relate to average purchasing power and may mask significant differences across household categories.


