


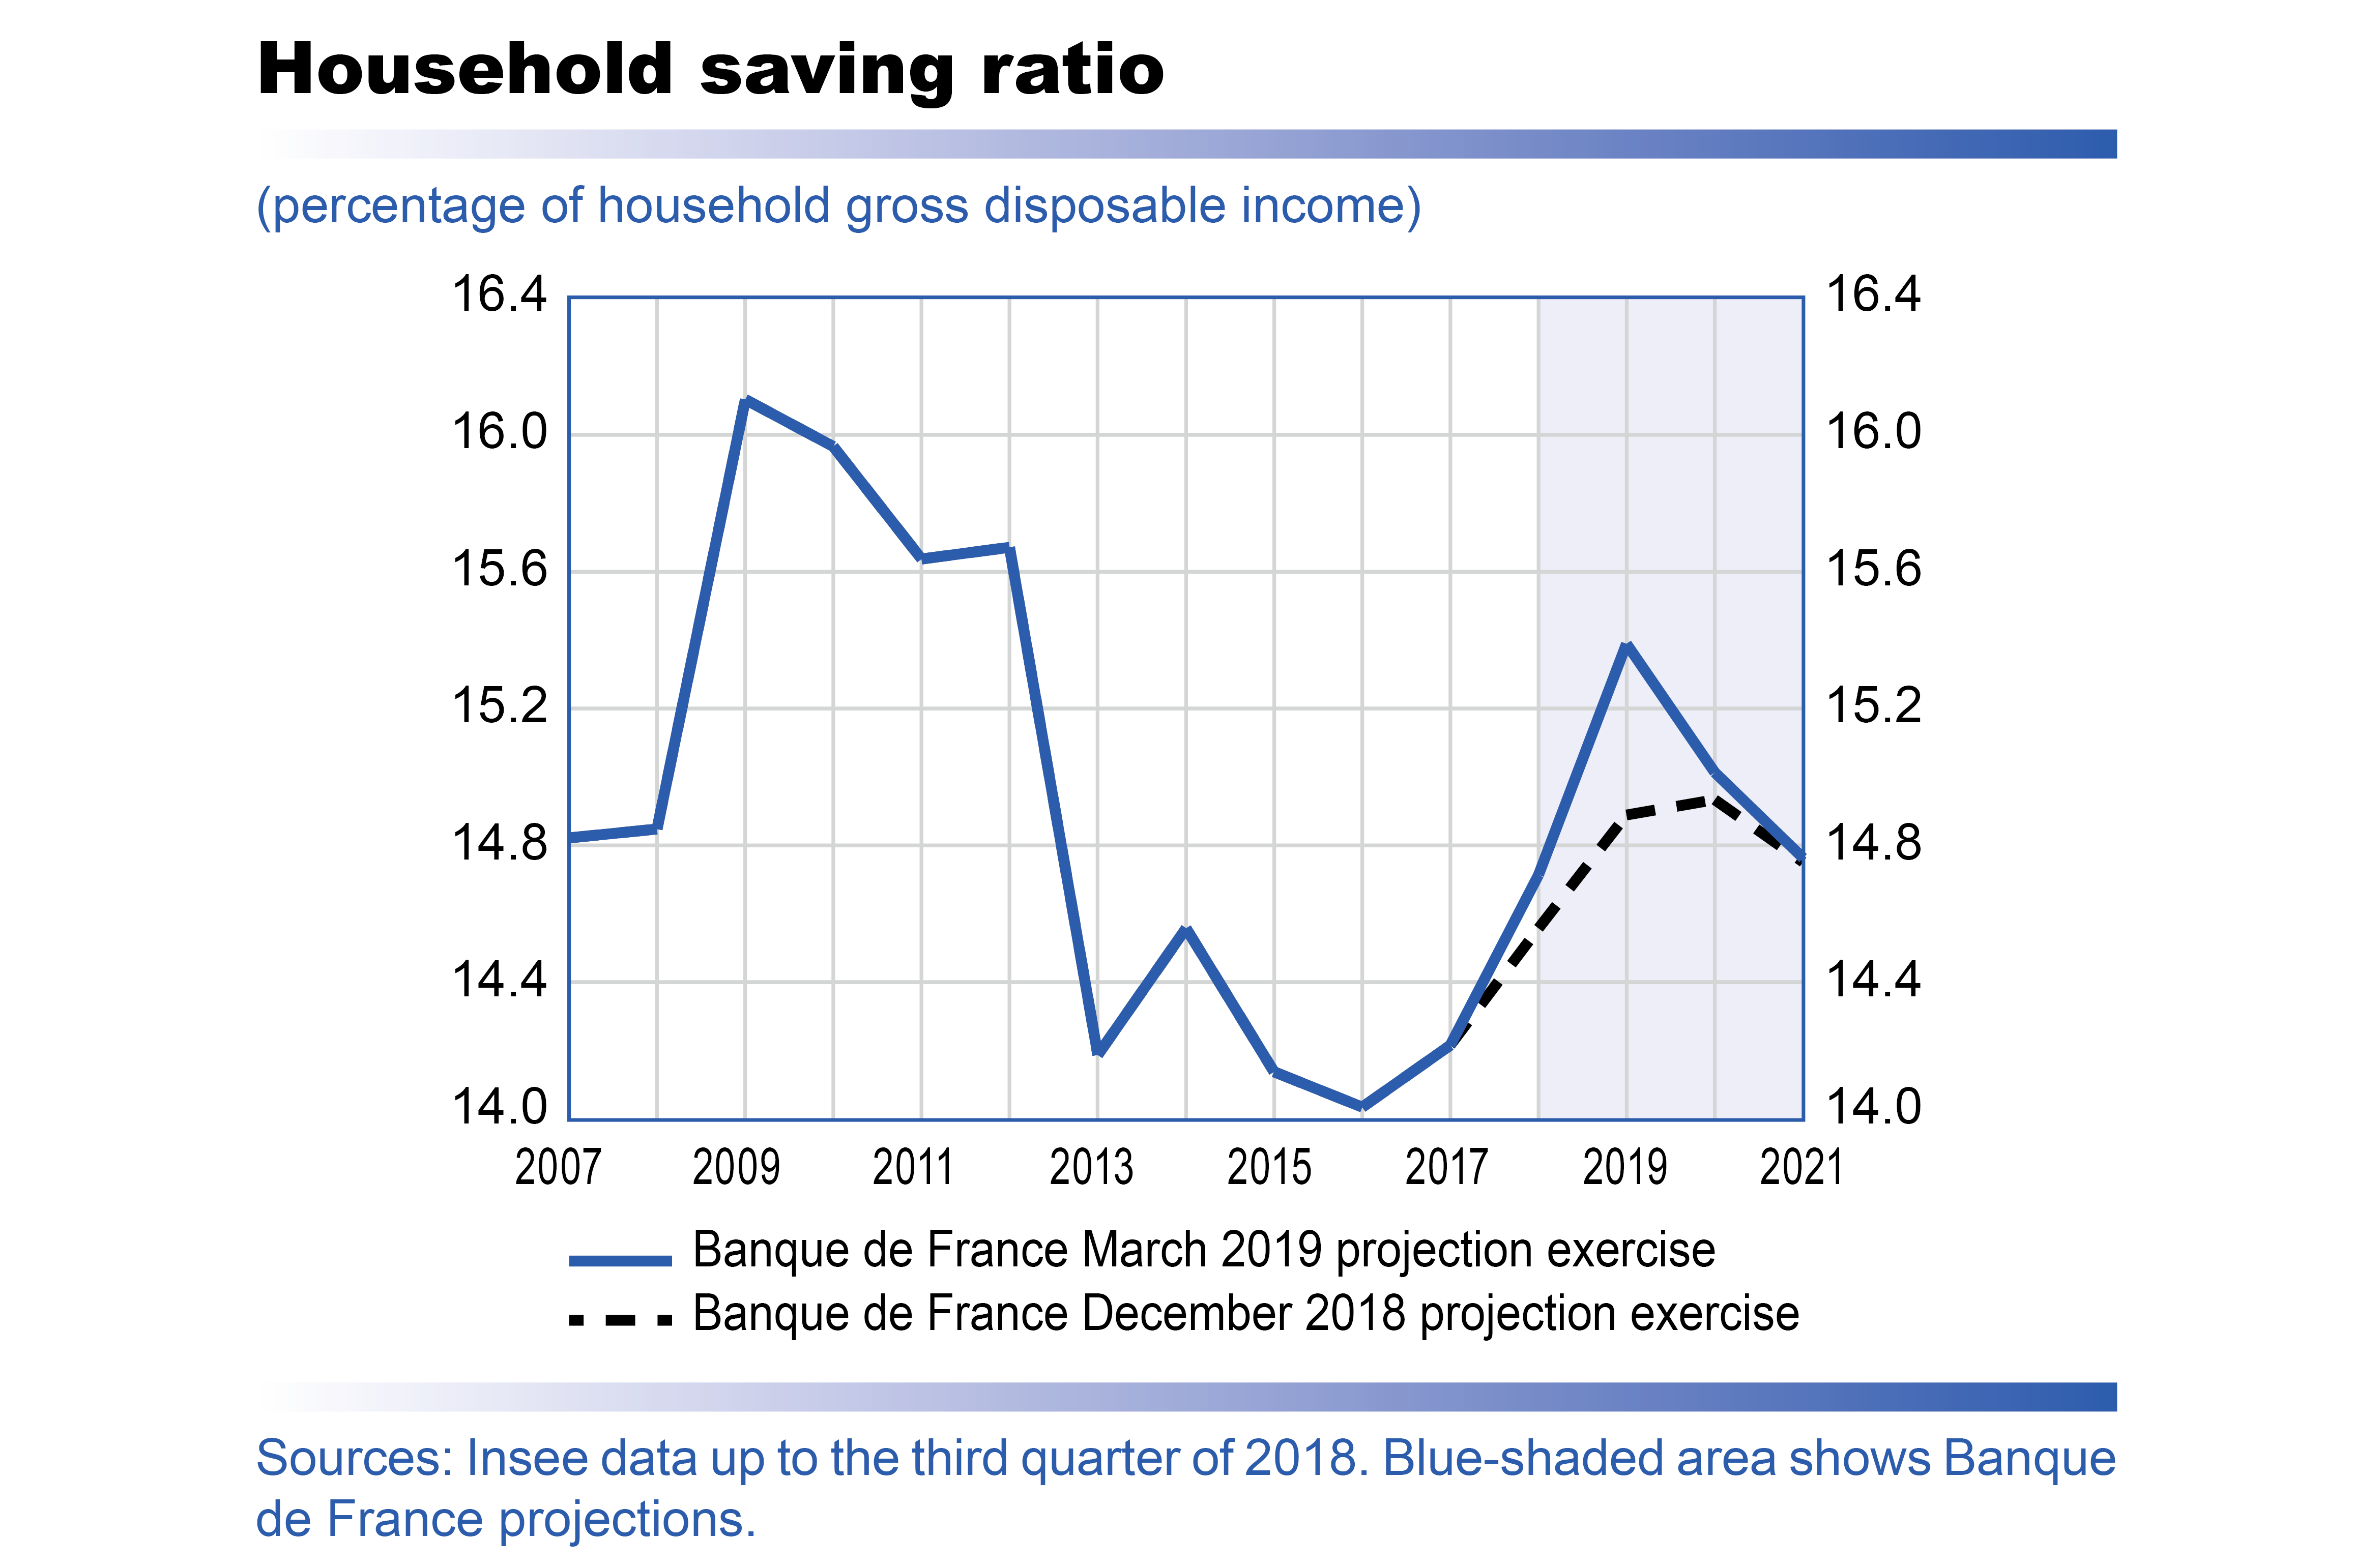
On a domestic level, one of the main changes since our December 2018 projections is the incorporation of the emergency economic and social measures (MUES) voted into law at the end of December. All things being equal, these translate into an additional 0.7 percentage point boost to household purchasing power in 2019. The extra shock to purchasing power, which should be felt from the first quarter of the year, is expected to support household consumption in 2019 and 2020, adding a cumulative 0.3 percentage point to GDP growth. In cases such as this, consumer spending only adjusts gradually to growth in purchasing power; consequently, in the short term, a large part of the gains are also expected to translate into a rise in the saving ratio (see chart). The household saving ratio has thus been revised upwards sharply by 0.5 percentage point for 2019, but should gradually return to the level expected in our December publication in 2020 and 2021 as the gains in purchasing power are consumed.

Economic projections Macroeconomic projections - March 2019
▪ French GDP should grow by around 1.4-1.5% per year between 2019 and 2021. This growth rate, which has been slightly revised since our December 2018 projections, should lead to a gradual fall in unemployment to 8% in 2021.
▪ After the disruption to activity caused at the end of the year by the gilets jaunes protests, economic activity is showing signs of improvement. This is expected to continue over the coming quarters, thanks in particular to substantial average purchasing power gains of around 2% per inhabitant that should benefit households in 2019.
▪ The deceleration in world demand is expected to weigh on activity, even though France is slightly less exposed than some of its larger euro area partners, until mid-2019. Growth should then be sustained by an international environment that is becoming generally favourable once again and export market shares that are expected to stabilise.
▪ After an annual average high of 2.1% in 2018, HICP inflation should decrease to 1.3% in 2019, in line with the fall in oil prices since their mid-2018 peak. It should then fluctuate around 1.6-1.7%. Inflation excluding energy and food is expected to recover gradually to 1.5% in 2021, sustained by global inflation and rising wages in France.
▪ After a period of quasi-stability in 2018 at 2.6% of GDP, the government deficit is expected to climb temporarily above 3% of GDP in 2019, given the one-off effect related to the transformation of the Tax Credit for Competitiveness and Employment (CICE). It should then be reduced significantly, helped by economic growth, in order to bring about the required reduction in the government debt ratio.
▪ This outlook is subject to significant risks that could weigh on growth and inflation.
In a more uncertain environment, French growth is expected to show resilience
The French economy experienced a marked slowdown at the beginning of 2018, with average quarterly growth of 0.2% during the first half of the year after an average 0.7% throughout 2017. This slowdown affected all the components of demand, particularly exports and household investment, but also business investment and, to a lesser extent, household consumption.
Activity then improved a little in the second half of 2018 with quarterly growth of 0.3% despite the disruption caused at the end of the year by the gilets jaunes (yellow vest) protests. This trend should continue over the coming quarters. Based on the Banque de France’s business survey published on 11 March, we estimate GDP growth of 0.3% for the first quarter of 2019. During the rest of 2019, French economic activity is expected to be affected by weak demand from its trading partners, but should nevertheless benefit from the strong rebound in household purchasing power and consumption, sustained by the fall in oil prices at the end of last year and the significant budgetary measures (the MUES measures, a draft law to introduce the mesures d’urgence économiques et sociales (MUES – emergency economic and social measures), see below) voted into law in December 2018. Quarterly GDP growth is therefore expected to gain momentum between mid and end-2019.
Annual average GDP growth is expected to be 1.4% in 2019, down slightly from 2018 (1.5%). Essentially, this apparent slowdown in annual average terms reflects far slower momentum at the beginning of the year: at the end of 2017, the carry-over effect for 2018 was 1.0% compared with an end-2018 carry-over effect for this year of only 0.4%. However, over the full year, momentum should be markedly more favourable: economic activity should expand by 1.7% year on year in fourth quarter 2019 compared with growth of only 0.9% at end-2018 (see Chart 1 above).
Beyond 2019, the outlook should remain favourable as the output gap is likely to narrow from the beginning of 2020 as a result of slightly-above-potential GDP growth, and the expansion in activity should settle at a quarterly rate of around 0.3-0.4% in 2020 and 2021. Annual average GDP growth is expected to be 1.5% in 2020, driven by strengthened foreign demand for French goods and services, and therefore exports, during the year.
These projections incorporate the quarterly national accounts published by Insee on 28 February, which cover the period up to the fourth quarter of 2018. They are based on the technical and international environment assumptions used in the Eurosystem March projection exercise, for which the cut-off date is 12 February. They also take account of the government measures included in the 2019 budget law, and in particular the emergency economic and social measures (MUES) approved by the National Assembly on 21 December 2018, which were not taken into account in our December projections.
Since our December projections, support from foreign demand is expected to be less significant in the short term but this is counterbalanced by a sharp upward revision of the outlook for household purchasing power
The slight downward revision to our GDP growth projections for 2019 to 2021 compared to our December 2018 publication is the result of contrasting trends.
First, the technical and international environment assumptions present less favourable activity in our partner countries in the short-term, although it will again pick up momentum in 2020 (see Chart 2). It is thus expected that foreign demand for French exports will only rise by 3.1% in 2019 after 3.6% in 2018, with a marked slowdown in extra-euro area demand in particular. Due to the orientation of its foreign trade, France is however expected to be less exposed to the downturn in global economic activity than some of its trading partners (see Chart 3). Growth in foreign demand for French exports should strengthen again in 2020 at 3.7%. Moreover, the French economy should benefit from the past slight depreciation in the exchange rate and particularly from the fall in oil prices at the end of 2018, which is expected to boost household purchasing power and corporate margins.
French economic activity should also be sustained from the beginning of 2019 through to 2020 by the expected effects of the government’s MUES measures (see above and Box 1).
The gains in purchasing power of household disposable income should be significant in 2019, notably due to the MUES measures
The purchasing power of household disposable income should be buoyed in 2019 by robust household labour income, by weak headline inflation thanks to the fall in oil prices and by the MUES emergency economic and social measures. Purchasing power per inhabitant should increase by 2.1% during the year, reflecting the highest rate of growth since 2007. This average change across the population as a whole obviously covers a range of situations depending on the household categories (see Box 2 for a discussion of the measurement methodology).
This should boost the upward trend in purchasing power begun in 2014 (see Charts 4 and 5). This figure has been revised substantially upwards (0.7 percentage point) since our December projections following the integration of the MUES measures. The growth in purchasing power is then expected to be more moderate in 2020 and 2021, even though it should continue to be buoyed by the growth in household labour income (see Chart 6).
Until the beginning of 2018, earned income was driven by strong growth in employment. Although, as an annual average, net job creations remained at a high level in 2018 (257,000), the rate of job creations has dropped off sharply since the second quarter of 2018 due to cuts to subsidised jobs, the effects of labour cost reduction policies (the CICE and PRS measures, Crédit d’impôt pour la compétitivité et l’emploi (CICE – the Tax Credit for Competitiveness and Employment) and Pacte de responsabilité et de solidarité (PRS – the Responsibility and Solidarity Pact)) reaching their conclusion and the slowdown in economic activity.
This slowdown should translate into less robust job creations of around 125,000 in 2019 (as an annual average) and also into an increase in productivity gains that could encourage wage increases. In 2020 and 2021, job creations should again gather pace with a stabilisation of public sector employment and the rebound in activity benefiting private sector employment, while maintaining a balanced distribution of growth between job creation and productivity gains. This growth in total employment should result in a gradual decline in the unemployment rate to an expected average of 8.0% over the year in 2021.
During the 2016-18 period, earned income was essentially driven by job creations (more than 750,000 in three years) but conversely growth in productivity was weak (see Charts 7 and 8). Currently though, labour productivity is accelerating by between 0.8% and 0.9% per year and growth is now therefore expected to generate slightly fewer jobs but higher wages (up 2.3% in 2019 and 2020, and 2.6% in 2021, after a 1.9% increase in 2018, in the private sector). In the context of falling inflation in 2019, the gains in the purchasing power of wages should thus be particularly significant in 2019 (1.2% after 0.3% in 2018) and then should remain substantial during the following years (around 0.8% in 2020 and 0.9% in 2021).
A rebound in household consumption in 2019 and in exports in 2020 should be the main driver of growth
Growth in household consumption was limited in 2018 at 0.8% despite significant gains in purchasing power (1.4%) that were however concentrated in the second half of the year. Indeed, the household saving ratio continued to increase after bottoming out in 2016 (see chart in Box 1 “Emergency measures, saving ratio and consumption”). From the beginning of 2019, household consumption is expected to rise sharply, driven by still-strong momentum in purchasing power. Of course, as is often the case after experiencing a major shock, significant gains in purchasing power are only expected to materialise gradually in additional household consumer spending. Household consumption should therefore accelerate in 2019 but should also remain robust in 2020. The saving ratio should peak at 15.4% in 2019 (after 14.7% in 2018) before gradually faltering in 2020 and again in 2021.
In 2018, the rate of growth of household investment fell steadily and even entered negative territory in the second half of the year. The recent downturn in home sales and housing starts suggests that this decline, while gradually subsiding, could continue during most of 2019. Household investments should then grow at a pace more in line with gains in purchasing power.
Business investment is projected to continue to rise faster than economic activity as a whole but its growth rate should weaken steadily over the projection horizon so that the investment ratio, which is at a record high, should start to stabilise. Business investment has notably been driven by spending on intangible assets over recent years and this trend is expected to continue.
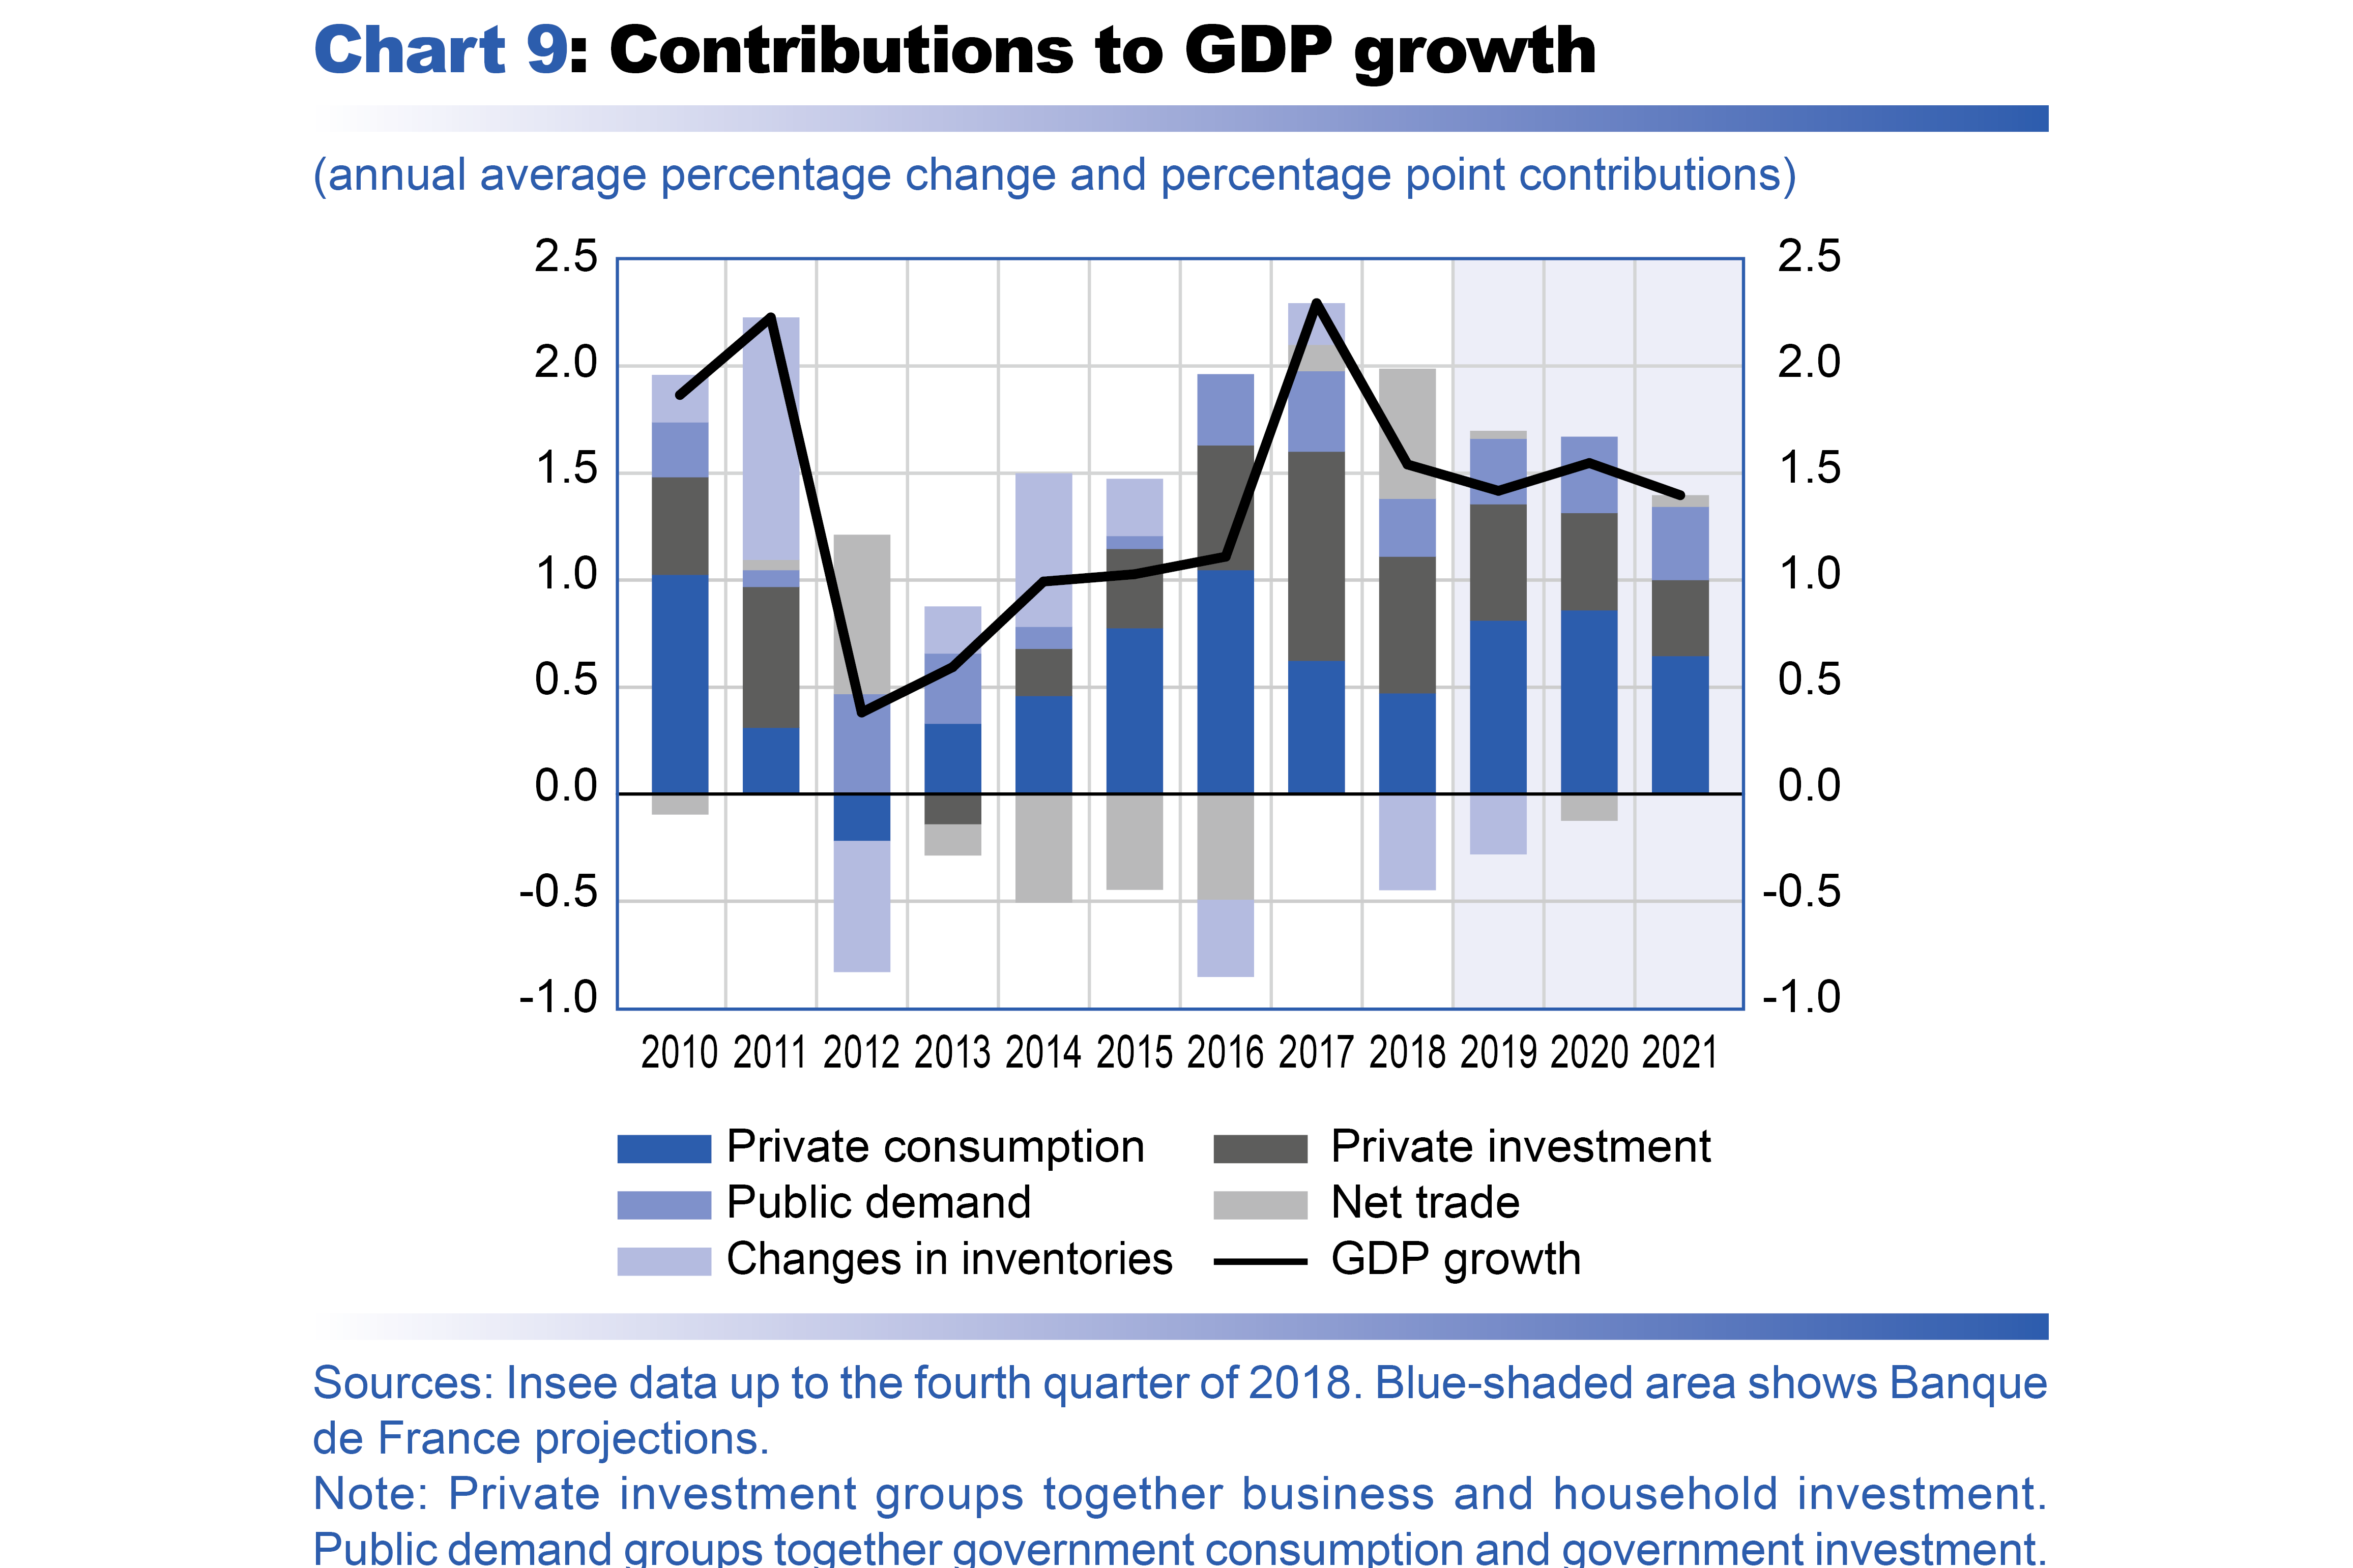
Lastly, external trade is expected to follow an uneven trend. After a sharp increase in the last quarter of 2018 following substantial deliveries in the shipbuilding and aeronautical sectors, exports should experience a snapback in the first half of 2019. Beyond these fluctuations, exports are projected to follow demand for French goods and services. The strengthening of foreign demand in 2020 should help exports gain momentum, thereby contributing to the pick-up in economic growth. As for imports, they should change in line with trends in demand. In particular, the robust growth in household consumption in 2019 and 2020 should contribute to a peak in import growth in 2020, leading to a slightly negative net contribution of foreign trade during the year (see Chart 9).
After 2.1% in 2018, headline inflation should temporarily moderate at 1.3% in 2019, and then fluctuate around 1.6-1.7% in 2020-21
After peaking at 2.6% in July and August 2018, the annual change in the Harmonised Index of Consumer Prices (HICP) gradually shrank back following the fall in oil prices to 1.4% in January 2019. It should decline a little further during the rest of the year (see Chart 10), even going down to around 1% in some months. Headline inflation should average 1.3% for the year in 2019 and then strengthen in 2020 and 2021 to fluctuate around 1.6-1.7%.
The decline in HICP inflation in 2019 (and the revision since our December projections) can mainly be explained by the sharp decline in energy inflation, in line with both the change in oil prices and the absence of an increase in the domestic consumption tax on energy products (TICPE) at the beginning of 2019, both of which had pushed up energy prices in 2018. However, following a dip in 2019, energy prices should grow again at a moderate pace over the remainder of the projection horizon. Food prices should continue to grow at a higher pace in 2019 as a result of the temporary impact of raising the threshold of sales loss by 10% for large retailers in February 2019 (estimated for the purposes of these projections at 0.1 percentage point of headline inflation), before slowing during the following years.
Inflation excluding energy and food should amount to 0.9% in 2019, unchanged from 2018, but with quarterly profiles already suggesting a strengthening at the end of 2019. Developments in services inflation and industrial goods inflation are expected to differ quite markedly. After gradually slowing down during the second half of 2018, notably due to substantially lower rents and telecommunication prices, services prices should pick up slightly, albeit at a slower pace than expected in our previous projections, driven by generally dynamic services prices in the private sector. Industrial goods prices on the other hand, which also lacked dynamism at the end of 2018, should remain sluggish as a result of contained import prices in 2018.
In 2020 and 2021, inflation excluding energy and food should see stronger, more sustainable growth, reaching 1.2% in 2020 and 1.5% in 2021. This increase should reflect a more robust labour market, characterised by a lower unemployment rate and higher wage increases, and more significant growth in prices of imported goods. Therefore, by the end of the projection horizon, inflation should be essentially driven by trends in prices excluding energy and food.
The government deficit is expected to climb temporarily above 3% of GDP in 2019, given the one-off effect related to the transformation of the CICE tax credit. It should then be reduced significantly, helped by economic growth, if France wishes to finally bring down its government-debt-to-GDP ratio
The government deficit in 2018 is estimated at 2.6% of GDP after 2.7% of GDP in 2017. It is expected to temporarily exceed the threshold of 3% again in 2019, rising to 3.2%. This projection takes account of the MUES measures, whose impact on public finances, net of announced financing measures, amounts to around EUR 9 billion. Excluding the temporary impact of transforming the CICE tax credit into a permanent cut in employers’ social security contributions, the deficit would be 2.3% in 2019. Government expenditure growth should remain relatively subdued in 2018 and 2019, with an average growth rate for the two years of 0.5% in real terms (adjusted for CPI excluding tobacco and excluding significant one-off measures), thanks mainly to savings made in public sector payroll and social security benefits. The government deficit should then be reduced significantly by 2021, helped by economic growth, at a rate that will however depend on the efforts made to stabilise public spending.
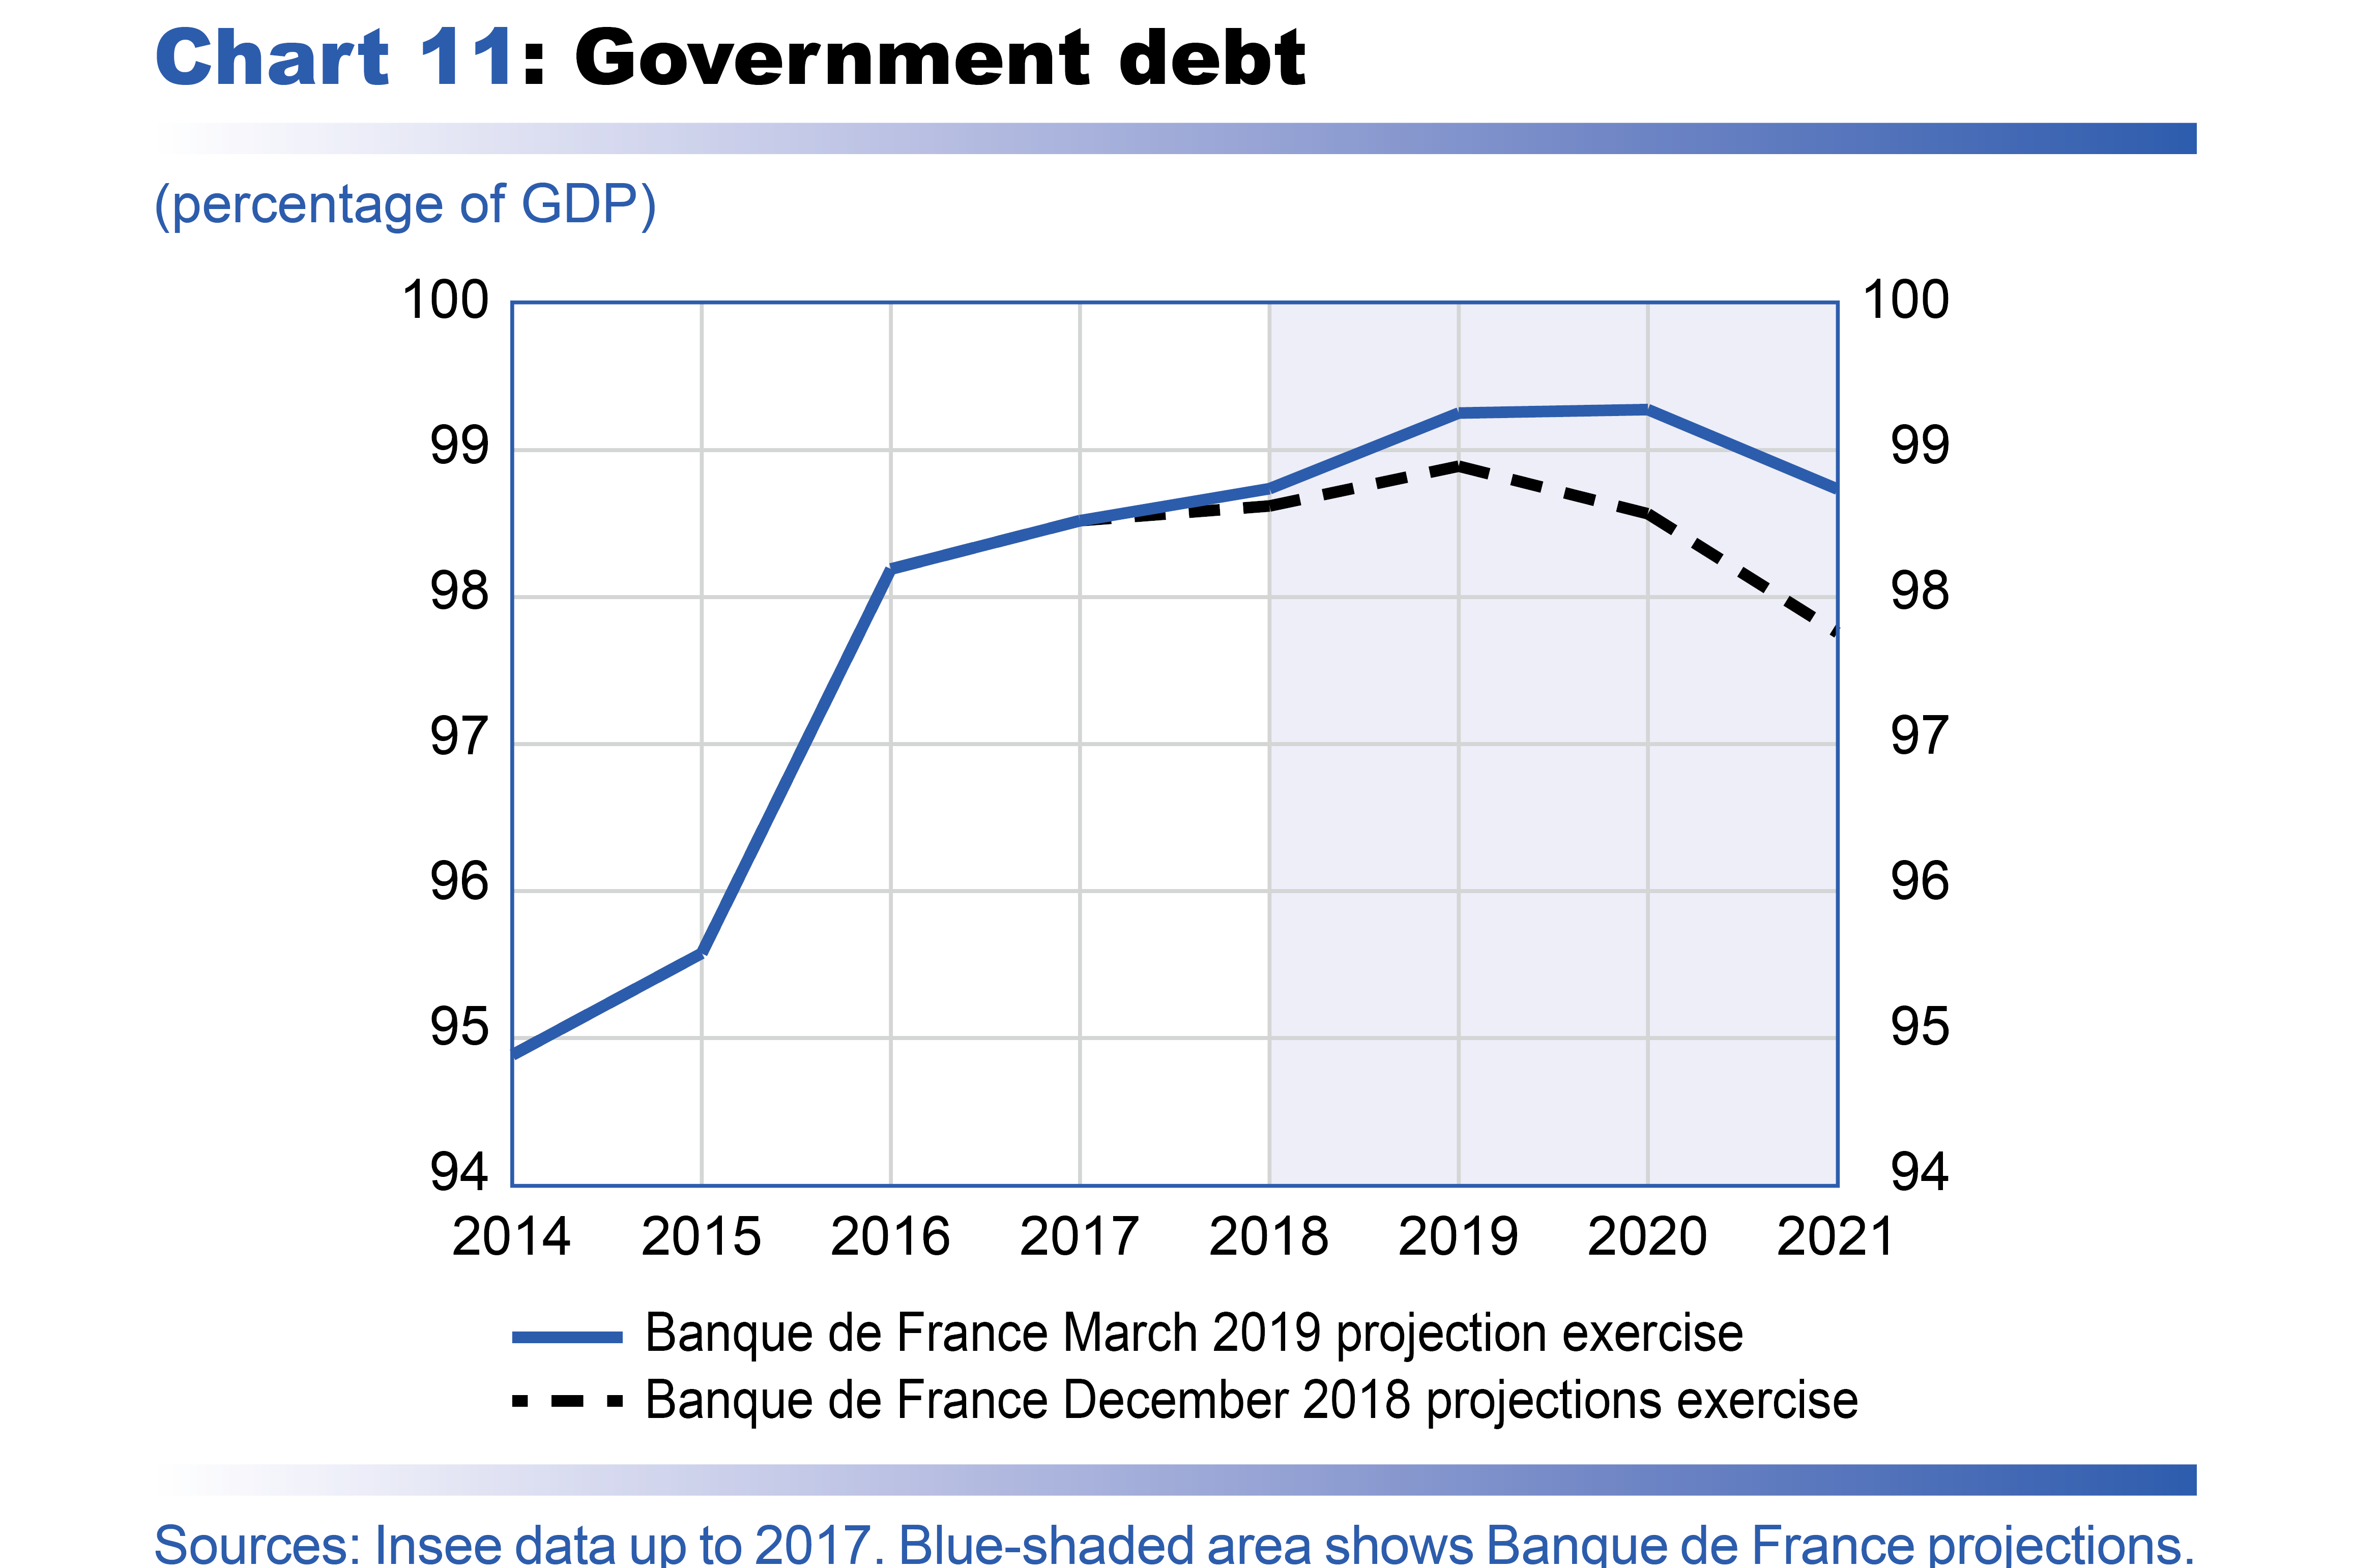
The government debt-to-GDP ratio is expected to continue to inch upwards to a level slightly below 100% of GDP in 2019 (see Chart 11). Its stabilisation and then reduction beyond this horizon requires ongoing efforts to reduce the primary deficit, which in 2019 is a little below 1% of GDP, excluding the temporary impact of transforming the CICE tax credit.
This outlook remains subject to significant risks that could weigh on growth and inflation
As in our December 2018 publication, these projections are subject to significant risks, notably due to the particularly uncertain international environment. Economic activity in France and the rest of the euro area is likely to be negatively affected by the outcome of Brexit and trade tensions at an international level in particular, with developments in both respects uncertain. Such tensions, should they continue and expand, could prolong the slowdown in foreign demand for French exports and weigh on economic activity.
In France, even though the MUES measures clearly contribute to an increase in purchasing power and thus consumption, uncertainties may exist as to the speed with which these gains in purchasing power will be used for consumption. These uncertainties are bidirectional as we could see a more rapid consumption of the surplus spending power, or on the other hand, a more lasting rise in the saving ratio.
Risks may also weigh on price movements. First, the volatility in oil prices brings both upside and downside uncertainties. Second, uncertainties remain particularly with regard to the reaction of prices in the large retail and complimentary health insurance sectors following the Food Law and the Health Law and with regard to the persistence of the downward trend in telecommunication prices. Furthermore, the recent weaker-than-expected price increases suggest that uncertainties remain as to the time required for wage increases to be passed on to prices and the magnitude of the rise in inflation over our projection horizon.
Measuring “gains in household purchasing power” consists in comparing changes in disposable income in current euro to changes in prices: when disposable income rises more rapidly than prices, there is a “gain in purchasing power”.
In this publication, “purchasing power” is measured using national accounts data. National accounts provide an aggregate measurement of household income in euro, net of taxes and social security contributions, referred to as “household gross disposable income” (GDI). In this case, the term “gross” indicates that no deduction has been made for the physical depreciation of household real estate assets. The major advantage of this measurement is that it covers all income earned by all households resident in France, broken down by source (wages, social security benefits, rental or financial income, etc.) and by type of deduction from income (income tax, social security contributions, etc.). By comparing GDI to the price estimations calculated using the household consumption deflator, we arrive at a measurement referred to as “real” household gross disposable income, or “purchasing power of GDI” (see the summary table on the first page of these projections).
Nonetheless, this measurement of purchasing power of GDI has two key limitations. The first limitation is that it uses the overall total income earned by all households. While total income may be important for the calculation of GDP growth, it does not provide a complete picture for average per capita purchasing power. However, this can be calculated by dividing purchasing power of GDI by the number of inhabitants to obtain “purchasing power per inhabitant”. According to Insee’s demographic data, the population of France has been rising over recent years by 0.3-0.4% annually. Consequently, in order to ensure that there is no decline in “purchasing power per inhabitant”, there must be a “gain in purchasing power of GDI” of at least 0.3-0.4% per year. Other, more complex methods for assessing purchasing power also exist. For example, Insee publishes data on purchasing power “by household” and “by consumption unit” (CU). CUs correct the concept of a household in order to take into account the fact that certain expenses such as rent, insurance, internet subscription, electricity bills, etc. are shared among household members.
The second limitation presented by this macroeconomic measurement is far more difficult to avoid within the framework of these projections. It relates to the effects of distribution: aggregating income for households as a whole does not take into consideration specific changes in the income of particular household categories, in the same way that using an average index of price changes does not take into account different consumption baskets within the population. While these factors may be important, it is difficult nonetheless to take them into account in the preparation of macroeconomic projections. The aggregate figures presented in this publication therefore reflect an average change across the population as a whole, which could cover specific developments within different population sectors depending on their income.
Download the PDF version of this document
- Published on 03/15/2019
- 9 pages
- EN
- PDF (389.93 KB)
Updated on: 03/15/2019 09:26