Different wage indicators paint a detailed and convergent picture of the wage trend and underpin our services inflation forecast
Evaluating the pass-through of inflation to nominal wages and the wage-price spiral is a key factor in our projections. In addition to our forecasts for the average per capita wage in the national accounts, a number of other wage indicators can be used to assess the trend in wages. In this box, we look at four of these indicators and deduce the implications for our forecast for the average per capita wage and inflation.
The first wage indicator is the SMIC, which stands for salaire minimum interprofessionnel de croissance and is the hourly wage below which employees cannot be paid. On 1 January each year, the SMIC is revised according to the rise since the previous SMIC revision in the consumer price index (CPI) excluding tobacco for households in the first income quintile, and half of the gain in purchasing power of the hourly base wage for labourers and employees. It is also revised in advance over the course of the year if the change in this CPI index since the previous SMIC revision exceeds 2%. The level of the SMIC is therefore highly dependent on inflation. With the upswing in inflation in 2022, the SMIC has been revised five times since the end of 2021, and in the first quarter of 2023 was 6.6% higher than a year earlier. According to our forecasts, the SMIC should be revised several times in advance between 2023 and 2025 (in addition to the 1 January revisions), but less frequently than in 2021 and 2022. As inflation recedes, the year-on-year change in the SMIC should decrease over the projection horizon, while still remaining high, and should be slightly above 3% in the final quarter of 2025. This is important as changes to the SMIC feed through to the rest of the pay scale via industry-level wage floors – which are notably revised upwards when they fall below the SMIC – and wage bargaining.
The second wage indicator that the Banque de France follows is the index of changes in industry-level negotiated wages, which is compiled by analysing the wage agreements signed in over 350 industries in France. The frequent revisions of the SMIC were gradually passed through to industry-level wage floors in 2022. At the start of 2022, wage agreements provided for increases of close to 3%; however, many industries – especially those where wages are close to the SMIC or which are experiencing hiring difficulties – reopened talks over the year and agreed on pay hikes of around 5% or above, which contributed to the sharp acceleration in negotiated wages at the end of 2022. Year-on-year, the average rise in negotiated wages increased from around 2.5% in the first quarter of 2022 to 5% in the fourth quarter of the year. The first agreements for 2023 indicate that inflation is continuing to feed through to industry-level wage floors, especially in those industries that did not review their agreement in 2022. However the pace of the rises appears to be easing: the first agreements provide for rises of between 4% and 4.5%. Over the rest of the projection horizon, the fall in inflation and lower growth in the SMIC should lead to a slowdown in negotiated wages.
The monthly base wage (MBW) index, which is the third indicator we follow, measures the average change in gross wages excluding bonuses and overtime, based on data from the ACEMO survey conducted by the Ministry of Labour’s research and statistics department, DARES. Base wages are directly affected by revisions to the SMIC and by industry-level wage talks. DARES also provides indexes by socio-professional category (SPC), which makes it possible to see whether the pay rises are homogeneous across workers. The year-on-year rise in the MBW has increased steadily since the start of 2022, from 1.7% in the fourth quarter of 2021 to 3.8% in the fourth quarter of 2022. The changes vary across SPCs: the MBW indexes for intermediate professions and executives have risen less (year-on-year growth of 3.2% and 2.9% respectively) than those for labourers and employees (up 4.6% and 4.3% respectively), probably because the latter categories are more affected by changes in the SMIC and industry-level floors. This heterogeneity is also a welcome indication of the absence of a wage-price spiral, as wage growth appears to vary depending on the economic conditions faced by different employee categories.
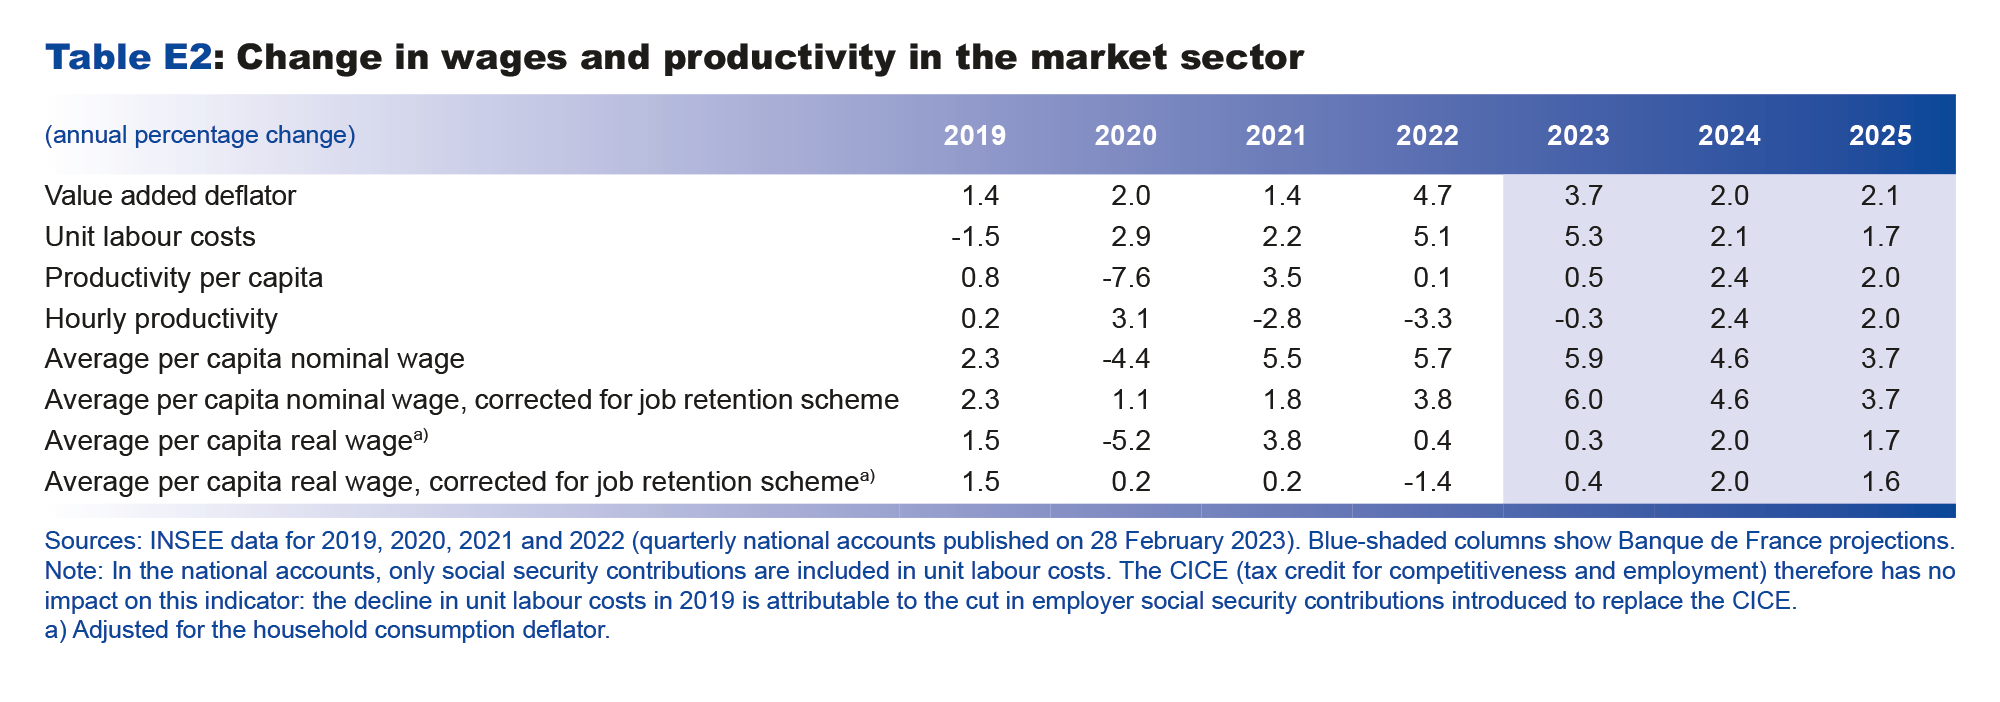
In the FR-BDF model used for the macroeconomic projection exercise, we forecast the change in the market sector average per capita wage, as this is the broadest measure of wages and is used to calculate household gross disposable income and hence their purchasing power. Unlike the MBW and negotiated wages, the average per capita wage includes overtime and bonuses – notably the prime de partage de la valeur (PPV – value-sharing bonus) which helped to boost per capita wages in the second half of 2022. The change in the average per capita wage also takes account of individual pay rises, entries/exits from the labour market and employment compositional effects across industries. Over the past year, the year-on-year change in the average per capita wage adjusted for the job retention scheme has increased significantly, from 1.6% in the fourth quarter of 2021 to 4.8% in the fourth quarter of 2022.
The upswing in inflation observed since the start of 2022 has been passed through to the entire pay scale (see chart). It was initially transmitted via the automatic revision of the SMIC, which progressively filtered through to industry-level floors and subsequently affected firm-level wage talks. The adjusted average per capita wage should therefore continue to accelerate over the start of the projection horizon, with year-on-year growth reaching 6.8% in the third quarter of 2023 (6.5% for the unadjusted average per capita wage), fuelled by the revision of the SMIC (+1.8 % in the first quarter of 2023), the pay rises that are currently being negotiated and a continuing historically low unemployment rate.
However, this growth in wages is not expected to trigger a wage-price spiral. Indeed, although the SMIC is rising sharply due to its inflation indexation, the other more aggregated indicators of wages (negotiated wages, MBW and average per capita wage) are seeing more limited growth. In general, unlike in the 1970s, wages are no longer indexed to inflation and only partially track the trend in prices. Also unlike in the 1970s, current monetary policy is helping to anchor inflation expectations and wage talks beyond the short term.
The increases in wages are expected to affect the components of inflation differently, and at a lag compared to the initial energy price shock. Inflation excluding services (food, manufactured goods and energy products) depends more on external factors such as commodity price or supply chain pressures, whereas services HICP (Harmonised Index of Consumer Prices) is the most affected by wages as it comprises labour-intensive activities that are more sensitive to wage trends. As commodity price and supply chain pressures fade over the coming quarters, inflationary pressures on the non-service components of the HICP should ease. All other things being equal, this should help to reduce headline inflation. This should in turn help to lower the mechanical rises in the SMIC, contributing to a slowdown in industry-level negotiated wages.
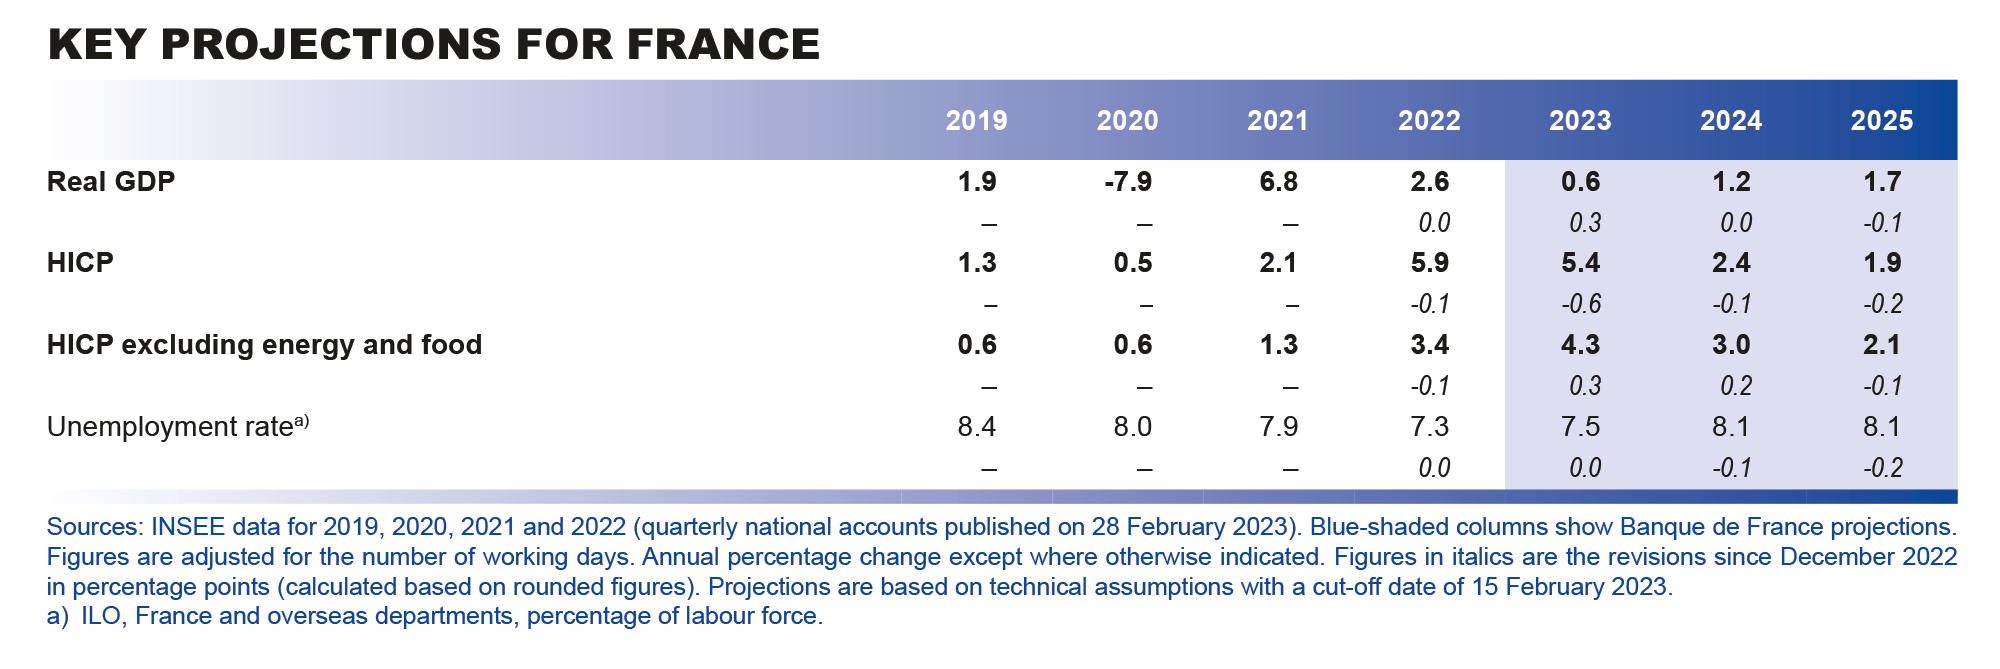
Overall, the easing of inflation is expected to feed through to firm-level wage bargaining and to the trajectory of the average per capita wage. After peaking in the third quarter of 2023, the year-on-year rise in the average per capita wage should gradually diminish, coming back to just over 3% at the end of 2025. This should feed through to the services HICP, which is expected to be the last component to see its inflation rate decline over the projection horizon, supporting the fall in the more important indicator of inflation – inflation excluding energy and food.


