Economic projections Macroeconomic projections - December 2018

▪ In a highly uncertain environment, French GDP should grow by around 1.5% per year in the period 2018-21, continuing to exceed potential and leading to a gradual fall in the unemployment rate.

▪ After making contrasting contributions between 2016 and 2018, external trade should have a broadly neutral impact on growth over the projection horizon.

▪ Domestic demand should continue to grow at a robust pace, with household consumption benefiting from stronger purchasing power in 2019 (see developments and boxes below).

▪ After the peak seen in the summer of 2018, headline HICP inflation should average 2.1% for the year, largely on the back of energy prices. It should then fluctuate around 1.6-1.7% between 2019 and 2021. Inflation excluding energy and food is expected to increase gradually to 1.6% in 2021 as unemployment falls.

These projections incorporate the quarterly national accounts published by Insee on 30 October, which cover the period up to the third quarter of 2018. They also factor in a rise of 0.2% in GDP in the fourth quarter of 2018, which was confirmed by the MIBA (Monthly Index of Business Activity) published on 10 December. The projections are based on the technical and international environment assumptions used in the Eurosystem December projection exercise (see Table A2 in the appendix in the PDF version of the document), for which the cut-off date is 21 November, in particular regarding oil prices. They also take into account the government measures announced up to the draft 2019 budget law, the majority of which will take effect in 2019, and some in 2020 (see below). They do not, however, incorporate the measures announced by the President of the Republic and the government after 28 November, which are liable to affect the evolution of consumer prices, purchasing power and the government deficit.

French growth should remain above its estimated potential

After a weak start to 2018, French economic growth gathered pace in the third quarter of the year. However, recent economic indicators suggest it should slow again temporarily in the last three months of the year, notably as a result of the disruption to activity caused by the gilet jaunes (yellow vest) protests. In annual average terms, GDP is expected to expand by 1.5% in 2018 after 2.3% growth in 2017. Beyond these quarterly fluctuations, however, the outlook remains favourable, and the expansion should settle at a quarterly rate of around 0.4% as of the start of 2019, resulting in annual average growth of 1.5% in 2019 and 1.6% in 2020 (see Chart 1). GDP growth should thus exceed our estimate for potential growth (around 1.3%), leading to a lasting closure of the output gap at end-2019. As the economic cycle progresses, GDP growth tends naturally to come back towards potential, and is thus projected to ease to 1.4% in 2021. In the medium term, the reforms underway – particularly if they are continued – could translate into a bigger drop in structural unemployment and a stronger boost to growth between now and 2021.

The growth outlook for 2018-20 is little changed compared with our September projections. The quarterly national accounts published by Insee in the third quarter of 2018 proved in line with our expectations. The downward revision to our growth forecast for 2018 and 2019 stems essentially from the temporarily less favourable outlook for the fourth quarter of 2018.

The technical and international environment assumptions are similar to those underlying the September projections, although they are now subject to a downside risk (see below). Growth in world demand is expected to weaken in 2018-21 after the sustained pace seen in 2017, and the outlook remains overshadowed by significant global uncertainty. France should nonetheless benefit from the resilience of the European economy: demand from euro area trading partners is expected to rebound sharply in 2019 after the soft patch seen in 2018, and should remain dynamic thereafter. The recent slight depreciation in the euro nominal effective exchange rate has not been sufficient to offset the strong appreciation since 2017, but should still give something of a boost to French competitiveness. Above all, after the recent sharp retreat, oil prices are now slightly below the levels underlying our September projections, which is more positive for the French economy.

After the recent peak, headline inflation should moderate up to mid-2019 and then hover around 1.7% in 2020-21

After peaking at 2.6% in July and August 2018, largely on the back of steep energy price rises and higher tobacco and energy taxes, inflation as measured by the annual change in the Harmonised Index of Consumer Prices (HICP) should moderate in the run-up to autumn 2019. It should then strengthen again gradually, fluctuating around 1.7% in 2020 and 2021 (see Chart 2).

Inflation excluding energy and food has already started to improve very gradually since the start of the year (averaging 0.9% in 2018 after the very low level of 0.6% in 2017), buoyed in particular by higher industrial goods prices. Services inflation should remain fairly weak in 2018, reflecting declines in social housing rents and telecommunications prices, and one-off reductions in transport prices, and despite rises in other services components. Inflation excluding energy and food should gradually see stronger growth (to 1.3% in 2019, 1.4% in 2020 and 1.6% in 2021), linked to falling unemployment and accelerating wages. This should help to balance out the composition of headline inflation, in a context of more moderate energy price rises after the declines seen at the end of 2018 and start of 2019.


Household consumption should remain robust, buoyed by gains in purchasing power

After three quarters of subdued growth, household consumption rebounded in the third quarter of 2018, in line with expectations. Household disposable income was temporarily squeezed at the start of the year by hikes in energy and tobacco taxes and a rise in the CSG (general social security contribution). Conversely, at the end of the year, cuts to housing tax and employee social security contributions coupled with lower energy prices should lend strong support to purchasing power. Household purchasing power is therefore seen rising significantly over the year, adding 1.4% in annual average terms. Purchasing power should then increase more sharply in 2019 (1.7% growth), before losing momentum gradually in 2020 and 2021 (see Box 1, “Changes in purchasing power in France”).

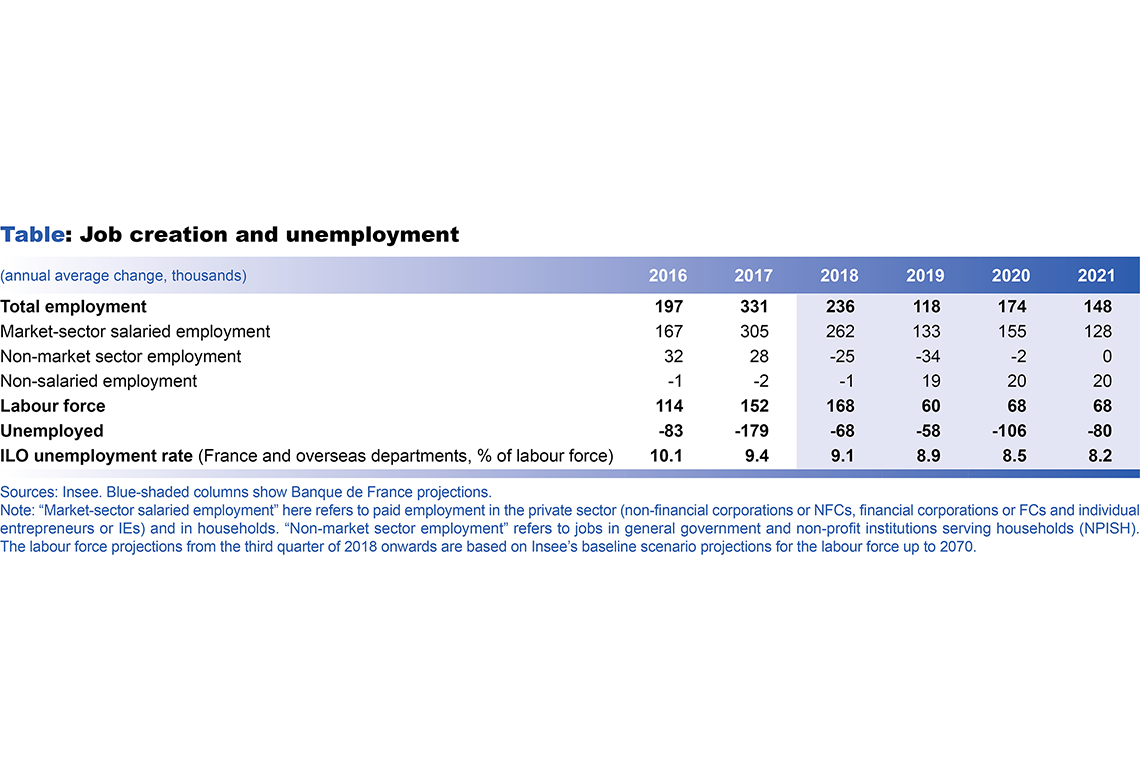
Recent labour market data show that employment growth slowed as of the second quarter of 2018. The policy of cuts to labour costs had a particularly strong impact in 2016 and 2017, with the result that private sector employment should now continue rising, but at a weaker pace than in previous years (see Box 2, “Job creation and unemployment”). 2018 should still see solid employment growth in annual average terms, thanks to the carry-over effect at the start of the year. The cuts to subsidised jobs in the 2019 draft budget law are expected to weigh heavily on public sector employment at the end of 2018 and start of 2019, and total employment is expected to rise by just 118,000 in annual average terms in 2019, compared with growth of 236,000 in 2018. It should then regain momentum over the rest of the projection horizon. Based on Insee’s demographic forecasts, the predicted pace of jobs growth should allow the unemployment rate to continue falling, to an expected 8.1% for France and the overseas departments at end-2021, and to just under 8% for metropolitan France.

The higher gains in household purchasing power are expected to push household consumption growth up to 1.4% in 2019, and it should then remain at this pace over the rest of the projection horizon. This trend should be accompanied by a slight rise in the saving ratio, to an average of 14.8% in 2021 compared with 14.6% in 2018. (See box entitled “The composition of household income, the household saving ratio and household consumption”, in the September 2018 macroeconomic projections).

Trends in business investment and exports are expected to be favourable

Business investment is projected to remain buoyant, rising faster than economic activity, despite moderating gradually. This should translate into a continued increase in the investment ratio, albeit at a slower pace than in recent years.

In contrast, after two years of strong growth, household investment slowed markedly as of the first quarter of 2018. Recent data on home sales and housing starts suggest that the decline which began in the third quarter should continue until mid-2019. Thereafter, household investment should grow at a pace more in line with purchasing power.

External trade is expected to show contrasting trends in the first and second half of 2018. After a sharp rebound in 2017, export growth stagnated in the first six months of the year, reflecting a softening of intra-euro area demand for French goods and services. The end of the year should see a pick-up in momentum with the delivery of the cruise ship Celebrity Edge at end-October and increased deliveries in the aeronautical sector, which are traditionally high at the end of the year. Thereafter, export growth will largely depend on levels of foreign demand for French goods and services, and should accelerate slightly in 2020 compared with 2019, contributing to the pick-up in activity. Imports, on the other hand, proved especially weak up to the third quarter of 2018, and are expected to remain subdued over the full year. The slowdown should nonetheless be offset on the supply-side by significant destocking. As a result, the strong positive contribution of net trade to growth in 2018 (0.5 percentage point) is expected to be outweighed in large part by a marked negative contribution from inventories (-0.4 percentage point). Import growth should then return to a more usual pace in subsequent quarters, which explains the slight moderation in activity in 2019, despite the strength of domestic demand and exports (see Chart 3).

The government deficit and debt trajectories are subject to considerable uncertainty, particularly in 2019

In a continuing favourable economic and financial environment (see Box 3, “The outlook for the government debt burden”), the government deficit is expected to fall slightly from 2.7% of GDP in 2017 to 2.6% of GDP in 2018. Indeed, it would have narrowed even further, to 2.4% of GDP, without the one-off repayment of the dividend tax which adds 0.2 percentage point to the deficit in 2018.

Before the recent government announcements (made after 28 November and therefore not included in these projections) the government deficit was expected to increase temporarily to 2.9% of GDP in 2019 as a result of the transformation of the Tax Credit for Competitiveness and Employment (CICE) into a permanent cut in employers’ social security contributions, which should weigh by 0.9 percentage point of GDP. Excluding this impact, the deficit was estimated at 2.0% of GDP for 2019 (from 2019 onwards, the new French institution, France Compétences, is treated as a new general government body pending its classification as such by Insee. Its creation leads to similar-sized increases in government spending on the one hand, and in taxes and social security contributions on the other - around 0.3 percentage point of GDP - as of 2019. Consequently, it has no impact on the government’s deficit or debt).

In 2018, the aggregate tax-to-GDP ratio (tax and social security receipts as a percentage of GDP) should fall by 0.4 percentage point to 44.9% (vs. 45.3% in 2017), owing to the tax cuts introduced in the last budget (reduction of housing tax, transformation of the wealth tax into a tax on real estate assets and introduction of a flat tax on capital income). Excluding temporary measures, (we have stripped out the impact of the significant temporary measures - snapback in 2018 after the recapitalisation of Areva and Orano in 2017, 2017/2018 time profile of the repayment of the dividend tax - which make it difficult to evaluate the variation in government expenditure in 2018 versus 2017)  our projection is for government expenditure excluding tax credits to rise by 2.1% in nominal terms in 2018 and by 0.4% in real terms (adjusted for CPI excluding tobacco). The government debt-to-GDP ratio is expected to inch upwards in 2018.

There are a number of major risks to this outlook

As in our September publication, the international environment poses significant risks to these projections (rise in protectionism, global geopolitical tensions, uncertainties over Brexit, commodity price volatility).

The uncertainty over the final terms of Brexit and discussions over Italy’s draft budget both pose a significant downside risk to the environment in Europe and thus to the region’s economic growth. In addition, new protectionist measures or a more marked slowdown in Chinese growth could weigh on foreign demand for euro area exports. Conversely, current projections for world growth, which factor in a continuation of the slowdown observed since the start of 2018, could underestimate trends in global trade, especially if the current trade tensions subside.

In France, the near-term risks are largely negative given the direction of current economic indicators and the possibility that the gilets jaunes crisis will have an even stronger impact on activity at the end of the year. Activity would nonetheless rebound in 2019 if the situation were to return to normal. In 2019 and 2020, households could potentially consume a larger share of the cuts to taxes and social security contributions, lending additional support to activity. The measures recently announced by the government should also support purchasing power and consumption. 

The risks to our inflation projection appear on the whole balanced. In the current context of high volatility, the future path of oil prices poses a first major risk, both on the upside and the downside. The oil price assumption used in these projections is constructed using the average price level in the ten days preceding the cut-off date for the technical assumptions. In the space of a month, from 18 October to 22 November, the price of a barrel of Brent crude varied by 10 euro. At a two-year horizon, a variation of this scale has a 0.4 percentage point impact on French inflation (for an estimation of the impact of changes in oil prices on euro area and French inflation, see BDF blog post)  and a 0.2 percentage point impact on economic activity. This stems from a direct impact on the energy component of inflation and an indirect impact on inflation excluding energy and food. Further abrupt variations of this size remain possible.

Box 1 - CHANGES IN PURCHASING POWER IN FRANCE

Measuring gains in purchasing power

Measuring “gains in household purchasing power” consists in comparing changes in disposable income in current euro to changes in prices: when disposable income rises more rapidly than prices, there is a “gain in purchasing power”.

In this publication, “purchasing power” is measured using national accounts data. National accounts provide an aggregate measurement of household income in euro, net of taxes and social security contributions, referred to as “household gross disposable income” (GDI). In this case, the term “gross” indicates that no deduction has been made for the physical depreciation of household real estate assets. The major advantage of this measurement is that it covers all income earned by all households resident in France, broken down by source (wages, social security benefits, rental or financial income, etc.) and by type of deduction from income (income tax, social security contributions, etc.). By comparing GDI to the price estimations calculated using the household consumption deflator, we arrive at a measurement referred to as “real” household gross disposable income, or “purchasing power of GDI” (see the summary table at the beginning of these projections).

Nonetheless, this measurement of purchasing power of GDI has two key limitations. The first limitation is that it uses the overall total income earned by all households. While total income may be important for the calculation of GDP growth, it does not provide a complete picture for average per capita purchasing power. However, this can be calculated by dividing purchasing power of GDI by the number of inhabitants to obtain “purchasing power per inhabitant”. According to Insee’s demographic data, the population of France has been rising over recent years by 0.4% annually. Consequently, in order to ensure that there is no decline in “purchasing power per inhabitant”, there must be a “gain in purchasing power of GDI” of at least 0.4% per year. Other, more complex methods for assessing purchasing power also exist. For example, Insee publishes data on purchasing power “by household” and “by consumption unit” (CU). CUs correct the concept of a household in order to take into account the fact that certain expenses such as rent, insurance, internet subscription, electricity bills, etc. are shared among household members.

The second limitation presented by this macroeconomic measurement is far more difficult to avoid within the framework of these projections. It relates to the effects of distribution: aggregating income for households as a whole does not take into consideration specific changes in the income of particular household categories, in the same way that using an average index of price changes does not take into account different consumption baskets within the population. While these factors may be important, it is difficult nonetheless to take them into account in the preparation of macroeconomic projections. The aggregate figures presented in this publication therefore reflect an average change across the population as a whole, which could conceal specific developments within different population sectors depending on their income (see, for example, Insee’s retrospective analyses, France, social portrait and Household income and wealth in the “Insee Références” collection, 2018).

Purchasing power of GDI and purchasing power per inhabitant are expected, on average, to continue the upward trend begun in 2014

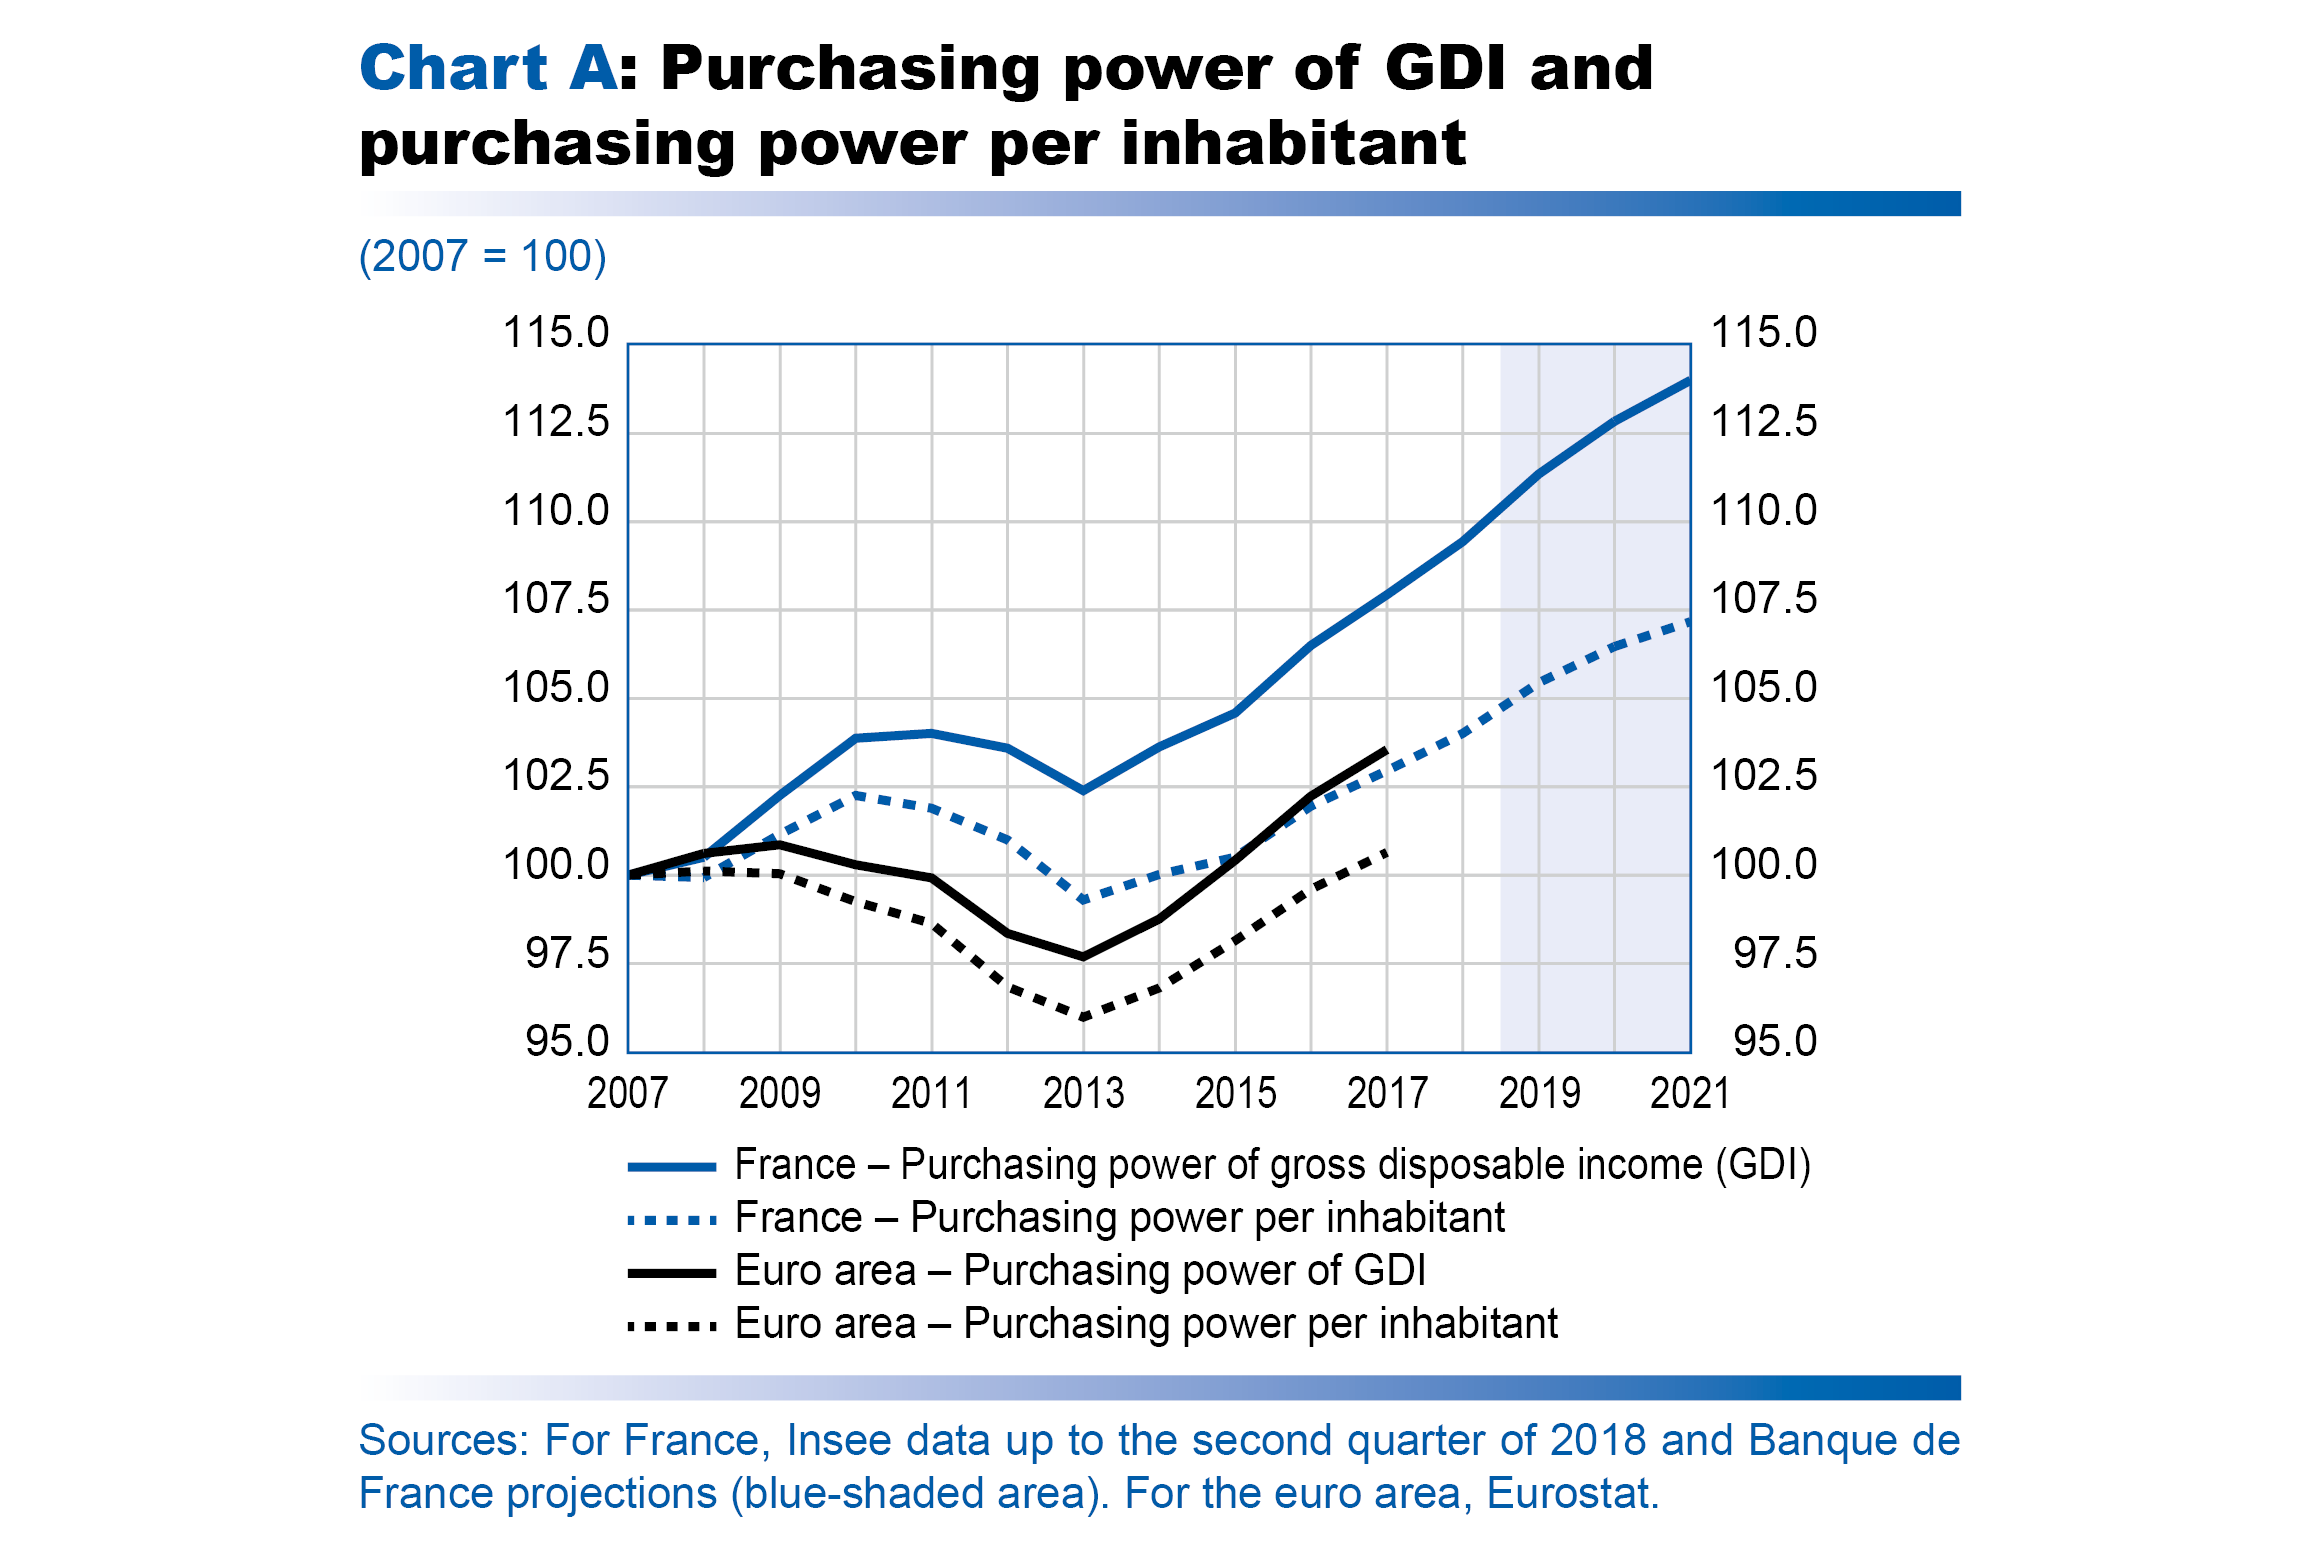
On the basis of the definitions and caveats set out above, we will now analyse recent developments and the projections for gains in purchasing power in greater detail. First, Chart A shows levels of purchasing power, indexed at 100 in 2007, for both concepts – purchasing power of GDI and purchasing power per inhabitant – in France and the euro area.

It demonstrates that purchasing power per inhabitant stagnated between 2007 and 2015 in France: during this period, the slight gains in purchasing power of GDI barely compensated for population growth. After reaching a low in 2013, purchasing power of GDI and purchasing power per inhabitant started to recover in 2014. Purchasing power per inhabitant thus picked up by 1.4% in 2016 and 1.0% in 2017, with an overall improvement of 3.7% between 2014 and 2017.

According to our estimates, which do not take account of the measures to boost purchasing power announced by the government after 28 November (the cut-off date for the preparation of these macroeconomic projections), purchasing power per inhabitant should continue to grow at a similar pace, rising by 1.0% in 2018 and 1.3% in 2019 (corresponding to growth in purchasing power of GDI of 1.4% and 1.7% respectively).

Changes in purchasing power for the rest of the euro area have been more unfavourable than in France since 2007

In the euro area as a whole, changes in both purchasing power of GDI and purchasing power per inhabitant have been more unfavourable than in France since 2007. In particular, the low observed in 2013 was far more pronounced, with a drop of around 4% in purchasing power per inhabitant between 2007 and 2013. Like in France, purchasing power per inhabitant has picked up since 2014, but the euro area had to wait until 2017, rather than 2015 in France, for it to return to its 2007 level. Between 2007 and 2017, purchasing power per inhabitant increased by only 0.6% for the euro area as a whole, compared with growth of 3.0% in France.

Purchasing power has been buoyed by tax measures and labour market improvements

Chart B allows us to deepen our analysis of the situation in France by presenting the four main contributors to annual changes in purchasing power of GDI.

• Labour income, which in the chart is separated out between gross average wages and employment.

• The net effect of social transfers and direct taxes and employees’ social security contributions.

• Other income, which mainly consists of self-employment income, rents and net financial income (interest and dividends paid and received).

• Prices measured using the household consumption deflator (changes in the deflator are deducted from changes in income in current euro to calculate gains in purchasing power). The household consumption deflator incorporates the effect of increases in indirect taxes on tobacco and fuel. These have a significant impact on these projections for 2018-20, as the estimates do not yet take account of the cancellation of the rise in fuel taxes announced by the government after 28 November.

The improvement in purchasing power for the period from 2014 to the end of the projection horizon can be broken down into three distinct phases. In 2014 and 2015, the turnaround in gains in purchasing power was mainly driven by very low inflation, thanks to the sharp drop in oil prices over the period. Nominal income grew slowly, however.

Income growth then gained greater momentum in 2016, and even more so in 2017, thanks to an increase in labour income, particularly with the substantial job creations observed in 2016 and 2017 (see Box 2, “Job creation and unemployment”). Furthermore, as is usually the case when activity picks up, “other income” also gained momentum in 2017, largely driven by the growth in self-employment income. This meant that the gains in purchasing power of GDI were maintained in 2017 despite an upturn in inflation.

In 2018 and 2019, earned income is expected to remain the main driver of gains in purchasing power of GDI, although with a slightly different composition: the pace of job creation is expected to slow but nominal wages are projected to gradually improve, in line with increased productivity (see Box 2). In particular, the average per capita wage in the private sector is expected to increase in 2019 by 2.3% in nominal terms, after 1.6% in 2017 and 1.9% in 2018. Moreover, the net effect of social security benefits received and direct taxes and social security contributions paid should underpin nominal income growth, particularly in 2019 when October 2018’s cut in employees’ social security contributions will bear upon the entire year. The measures announced since 28 November should lend additional support.

Box 2 - JOB CREATION AND UNEMPLOYMENT

The unemployment rate is expected to continue declining over the projection horizon, reaching 8.1% in the final quarter of 2021 for all of France (including the overseas departments).

Strong employment growth in the private sector as of mid-2015

The employment recovery initially proved feeble after the 2008-09 financial crisis, against a backdrop of weak economic growth. With total job creations averaging just 95,000 per year, the number of unemployed rose by more than 400,000 between 2009 and 2015, pushing the jobless rate up to an average 10.4% of the labour force in 2015 (compared with 7.4% in 2008).

The labour market only began to improve in earnest as of the end of 2015. Growth in market-sector employment accelerated markedly, with the number of people in work rising by an average of 250,000 per year between 2015 and 2018. The recovery took place in two phases. First, despite activity remaining subdued, employment growth picked up at the end of 2015 and in 2016 due to a marked slowdown in growth in apparent labour productivity (0.4% growth on average in the market sector in 2015 and 2016; see Table B3 in Appendix B). According to our estimations, this increase in the employment content of growth is linked to the policy of labour cost reductions initiated in 2014 (Tax Credit for Competitiveness and Employment or CICE, cuts to social security contributions, bonuses for new hires), which accounts for close to 400,000 net new jobs over the long term. (for further details, see Box 3 of the December 2017 macroeconomic projections ))

In the second phase, with the economic recovery gathering pace since 2017, employment growth has been accompanied by a gradual rebound in productivity, which should now rise by 0.9% in 2019 and by 0.8% in 2020 and 2021.

Employment growth should remain robust over the projection horizon

Following this period of acceleration, as the economic cycle progresses, the distribution of growth should become more evenly balanced between job creation and productivity gains. Employment should rise at a pace more in line with its usual determinants over coming quarters, while productivity gains should become more significant and consistent with their long-run trend, helping to support wage growth. The robust economic growth outlook for France over the projection horizon should thus result in 133,000 net job creations in the market sector in 2019 (annual average increase), 155,000 in 2020 and 128,000 in 2021 (see table). The impact of the recent reforms could gradually amplify this trend, particularly over the medium term.

The rise in private sector employment should be offset in part by a decline in public sector subsidised jobs at the end of 2018 and start of 2019. Overall, the total number of people in work is expected to increase by 118,000 in 2019, before rising more markedly in 2020 and 2021 (net job creations of 174,000 and 148,000 respectively).

In addition to the impact of this employment growth, the unemployment rate should also be driven down by a weaker pace of expansion in the labour force, attributable to demographic factors and to slower growth in the labour market participation rate (the ratio between the labour force and the working age population) than in recent years. Between 2015 and 2018, the number of people in the labour force increased by considerably more than the 92,000 originally implied by Insee’s demographic projections. This can be attributed to a faster-than-expected rise in the average effective pension age (resulting from government reforms), but also to previously discouraged workers – regarded as economically inactive according to the ILO definition – re-entering the labour force, encouraged by the high number of job creations (reversal of the “discouraged worker effect”). In forthcoming years, the labour force should grow at a pace more in line with Insee’s demographic projections, rising by around 68,000 per year. This should contribute to a continued steady decline in the number of unemployed (total reduction of 244,000 from 2019 to 2021) and in the unemployment rate.

Box 3 - THE OUTLOOK FOR THE GOVERNMENT DEBT BURDEN

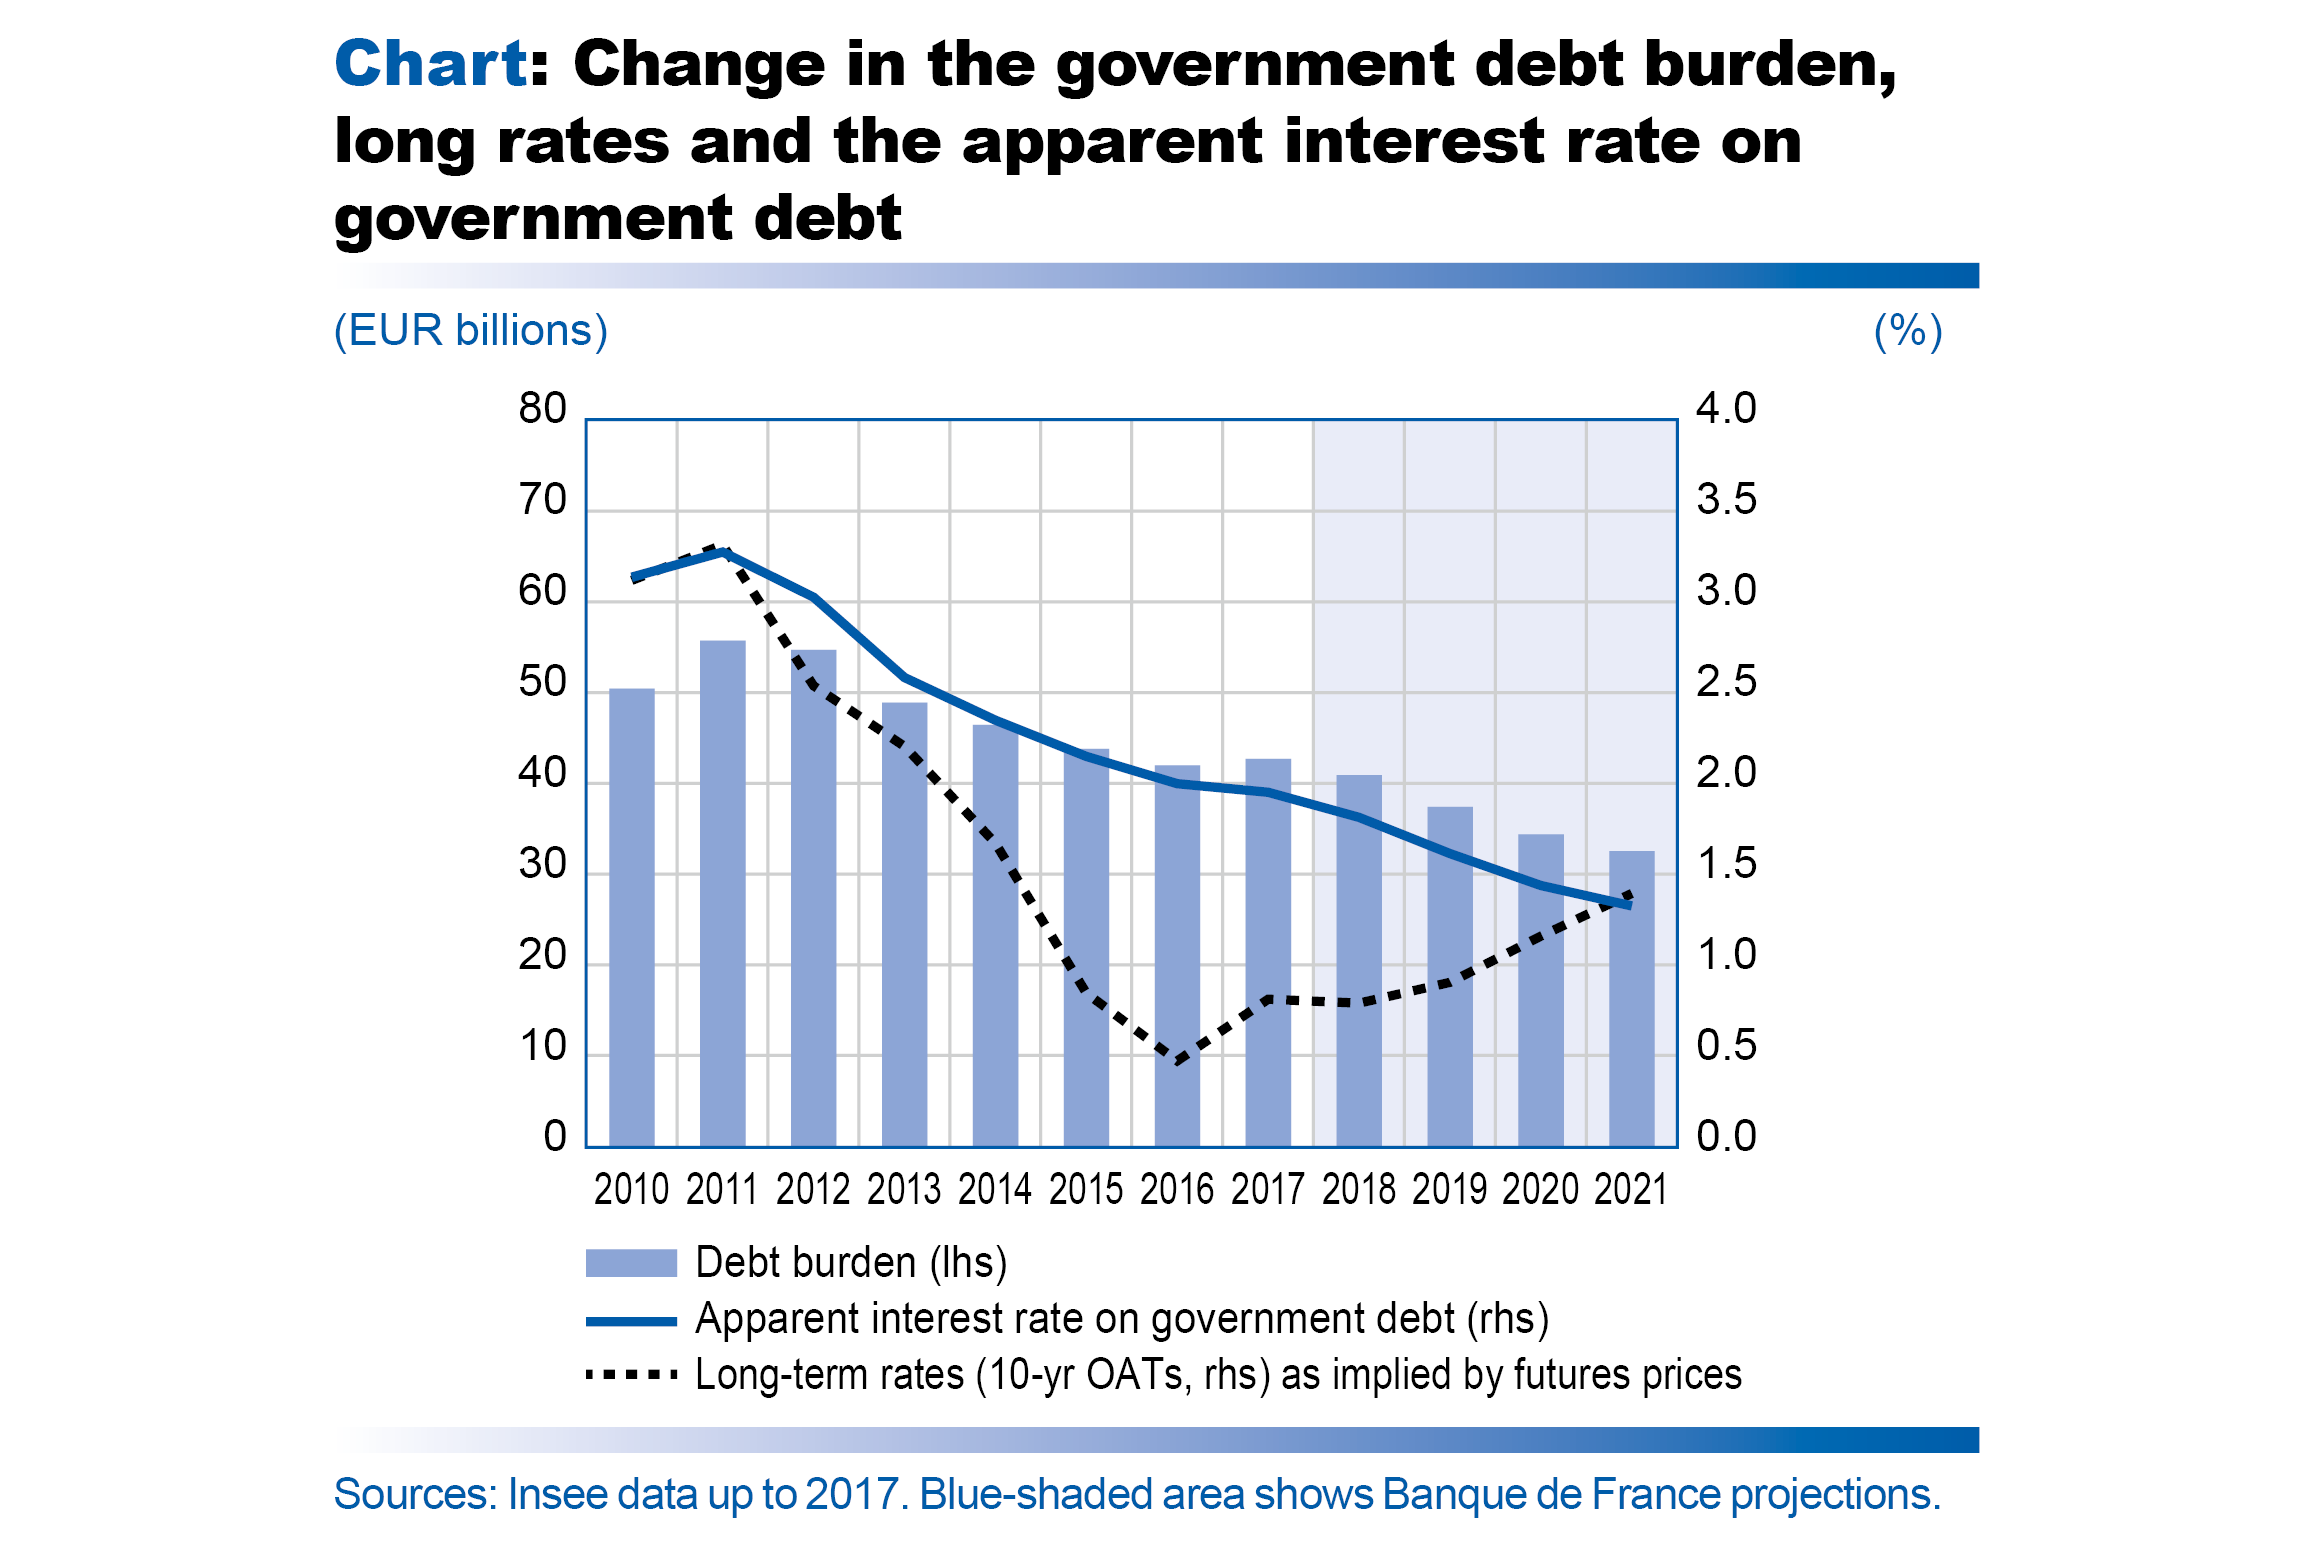
Between 2011 and 2017, the government debt burden declined steadily, shrinking from 2.7% of GDP in 2011 to 1.9% of GDP in 2017. The environment of declining interest rates thus enabled a marked reduction in this item of government spending, despite an increase of more than 10 percentage points in the government debt-to-GDP ratio over the period (from 87.8% of GDP in 2011 to 98.5% of GDP in 2017). As a result, the apparent interest rate on government debt, which measures the amount of interest paid as a share of total outstanding debt, fell sharply from 3.3% to 1.9% over the period. The estimations below are based on a government deficit trajectory that does not take into account the announcements made by the President of the Republic and the government after 28 November. In theory, our main conclusions regarding the evolution of the government debt burden should not be affected to any great extent.

Interest rates are currently very low by historical standards and it is likely that they will rise again in the future, even though the scale and pace of the increase remain uncertain. Indeed, market interest rates moved up slightly in 2017 from the low seen in 2016. Our standard assumption, based on the future path of interest rates implied by the yield curve as at 21 November, is for 10-year rates to rise over the projection horizon, from 0.8% in 2018 to 1.4% in 2021. It is important to understand how this affects the government’s projected debt burden: the impact depends on both the structure and maturity of its outstanding debt.

The interest due on the government’s short-term borrowing, which accounts for the majority of its annual issuance of debt securities, is directly affected by changes in short-term interest rates. The impact of a rate change on its long-term borrowing depends on the proportion of long-term debt that is reissued each year and the average yield on those securities reaching maturity relative to current market rates. Even if interest rates rise, long-term securities can still be reissued at a lower average yield than the securities they replace. Thus a variation in interest rates will have a lagged impact on the interest payments on long-term debt, and the actual scale of the impact will depend on the spread between the average yield on maturing securities and the current market rate. Given that the average residual maturity of the government’s debt was 7.8 years at end-2017 (9.6% of the government’s debt at end-2016 was reissued in 2017), this pushes back the full impact of a rise in market rates on government borrowing costs.

We expect the debt burden to continue declining over the projection horizon, falling from 1.9% of GDP in 2017 to 1.3% of GDP in 2021. The apparent interest rate on government debt is assumed to follow a similar path, but should stabilise in 2021 and then rise again over the longer term as the average yield at issuance begins to exceed the apparent interest rate. If market rates were to rise at a faster pace than factored into our projections, the government’s debt burden would naturally increase sooner. The government itself has included a more conservative projection in its draft budget law, with the 10-year rate seen rising faster and more sharply, reaching 2.15% at end-2019. This implies a higher debt burden than that assumed in our projections, which are based on technical assumptions derived from the market yield curve.

Download the PDF version of this document

publication
Economic projections Macroeconomic projections - December 2018
  • Published on 12/14/2018
  • 11 pages
  • EN
  • PDF (383.59 KB)
Download (EN)

Updated on: 12/21/2018 12:20