
Banque de France Bulletin no. 229: Article 2 After increasing until 2019, capital operating times are expected to decline in 2020
In 2019, capital operating times (COT) were up by 1.6%, a comparable increase to that of 2018 (+1.9%) reflecting the adjustments made by businesses to maintain or increase their activity. However, more than 50% of them reported being confronted with a lack of skilled labour.
Recruitment difficulties contributed to limiting the activity of nearly half of the companies surveyed. They concerned a small proportion of staff and key positions, with the constraint varying greatly according to the type of position, the company size and the sector of activity.
The Covid-19 health crisis is expected to have a lasting downward impact on capital operating times, with the effects of the reduction in activity outweighting the need to reorganise the production process. Subsequently, future challenges should involve the reorganisation of production, possible bottlenecks in raw materials or supplies.
1. Capital operating times continued to rise in 2019
The production conditions survey of the Banque de France provides information on the adjustments made by businesses to respond rapidly to variations in demand without changing their investment behaviour. Indeed, when faced with an unexpected rise or fall in demand, businesses first adjust via the capacity utilization rate (CUR) and capital operating times (COT). They then adjust the quantity of labour and capital – see in particular the study by Cette, Lecat and Jiddou (2016), which draws on these survey data.
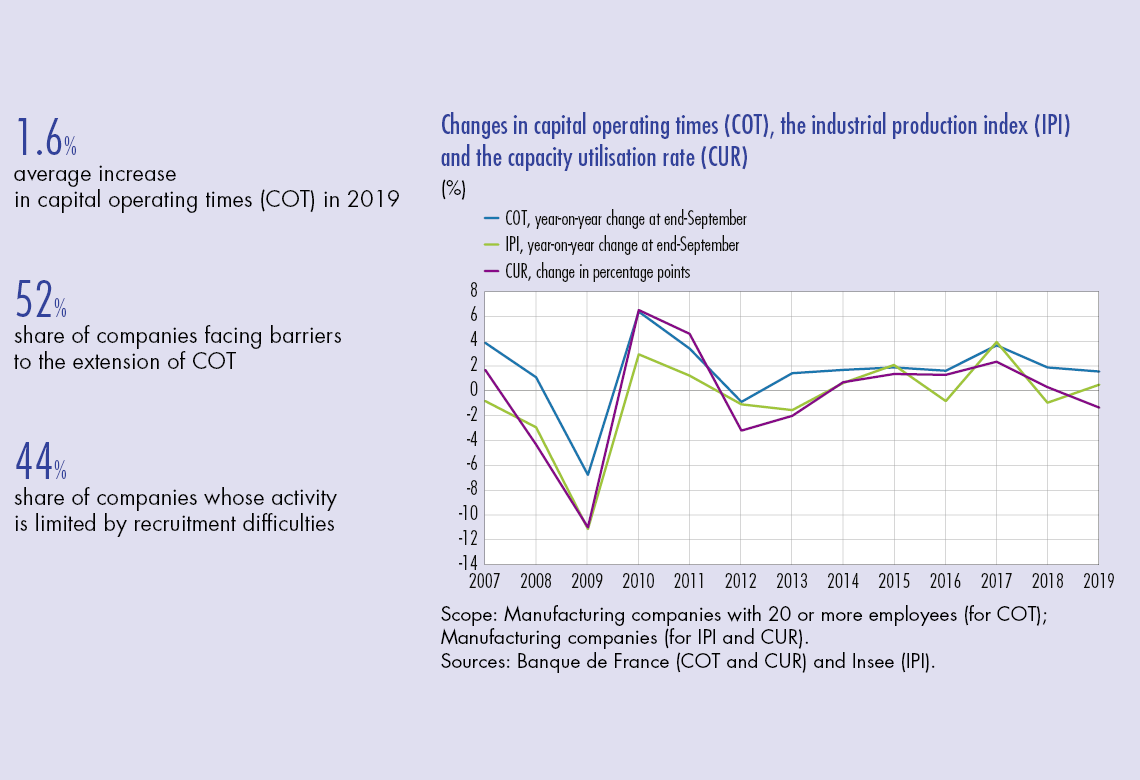
COT changes in line with industrial activity
Between 2018 and 2019, capital operating times grew by 1.6% on average, a rate comparable to that observed between 2017 and 2018 (+1.9%). At the same time, indicators in industry, in particular the capacity utilisation rate and the industrial production index (IPI) – see Chart 1 and Table 1 below – fluctuated little and GDP grew only slightly.
Capital operating times in small and medium‑sized enterprises slowed markedly between 2018 and 2019,while they accelerated slightly in large enterprises (see Table 1). This resulted in a convergence of COT growth rates between SMEs and large enterprises. Similarly, COT growth rates also fell in line across sectors. However, the transport equipment sector stands out with a strong increase. This sector has historically shown particularly sharp variations – see Charts 2a and 2b.
Recourse to shift work raises COT
In order to raise COT, and thus the use of their capital stock, companies can extend their employees’ working hours or reorganise production by having recourse to shift work, so that several operators take over from one another on the same post.
In 2019, 79% of manufacturing companies with 20 or more employees had recourse to shift work. This share is higher in large enterprises (94%) than in SMEs (68%), and is also highest in the transport equipment sector (88% – see Table 2).
Shift work accounts for a total of 33% of the workforce in all companies surveyed. Companies having recourse to shift work employ 43% of their workforce for this purpose, broken down as follows: 20% in discontinuous shift work, 14% in semi-continuous shift work and 9% in continuous shift work. This breakdown appears to be homogeneous across the different categories of companies. However, it varies from one sector to another, but discontinuous shift work is still predominant over semi-continuous shift work, which, in turn, is preferred to continuous shift work (cf. Table 2). …
Download the PDF version of this document

- Published on 07/29/2020
- 14 pages
- EN
- PDF (284.61 KB)
Bulletin Banque de France 229
Updated on: 07/29/2020 08:33