
Banque de France Bulletin no. 235: Article 5 Covid-19 and house prices in the UK: what can be learned from web-scraping data?
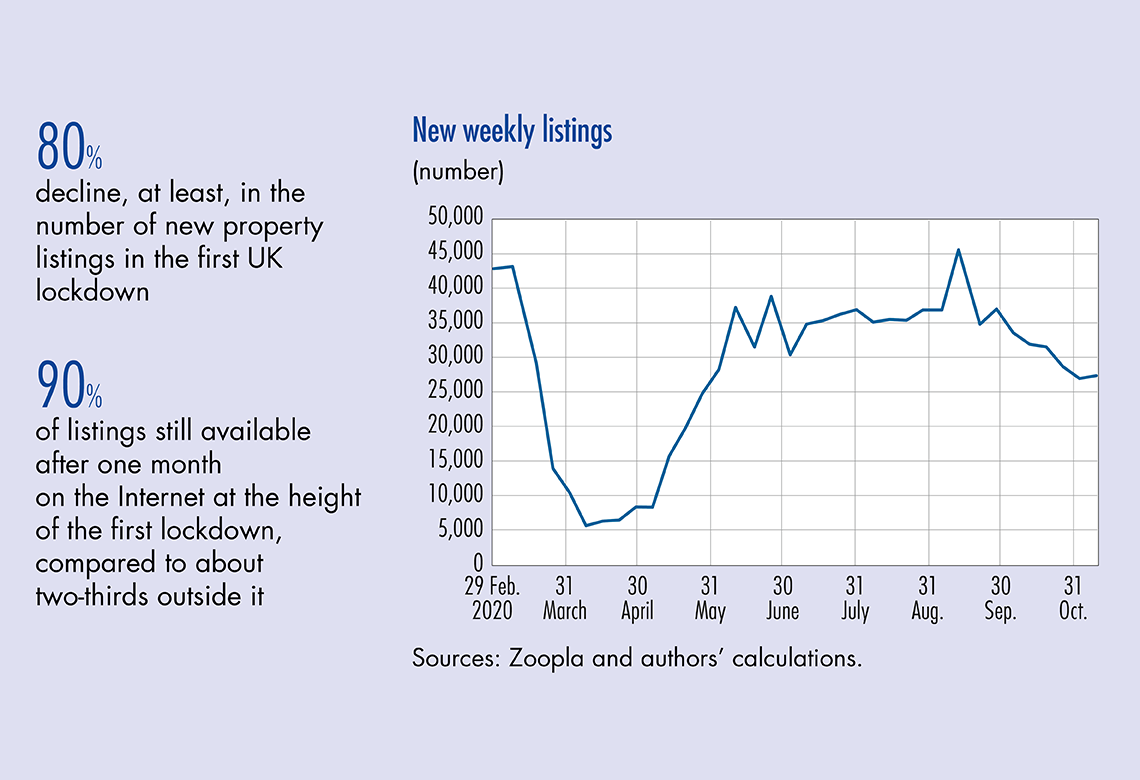
Official statistics on the housing market generally provide aggregated and/or lagged data. In addition, a lot of freely accessible granular information can be collected in real time from real estate websites using web-scraping techniques (automated retrieval of Internet data). Using the United Kingdom as an example, this article illustrates the value of a daily, granular and real-time database, particularly for analysing the behaviour of sellers. These data confirm that during the first lockdown period, activity stalled and sellers adopted a wait-and-see attitude. The granular approach also reveals significant regional differences: while advertised prices were stable or even increased after the first lockdown in more rural areas, they declined continuously in London.
1 Data from real estate websites: a useful supplement to official real estate statistics
Using alternative data makes it possible to construct indicators more rapidly (real-time daily indices vs. monthly/quarterly with a lag) and with greater granularity (e.g. at the postcode level) than is possible with official statistics. In this case, thanks to the higher level of granularity; we can detect imbalances in local housing markets. From a broader perspective, this article reflects recent attempts by economists to construct high-frequency indicators (e.g. Lewis et al., 2020). The availability of these indicators has become especially urgent due to the Covid-19 crisis and the sudden fluctuations in activity (see for example Bricongne et al., 2020). Indeed, it is even more important to make use of these data in real time during crisis episodes such as the Covid-19 pandemic, as the delays in the publication of traditional statistics means that economic downturns are only captured with a lag.
For instance, a large amount of data is publicly available in real time on real estate websites. This is particularly true for the UK housing market where 92% of estate agents advertise on Internet. The economic literature includes examples of the use of alternative data to monitor the housing market, such as Kulkarni et al. (2009) with Google Trends or, more recently, the use of web-scraping to analyse the housing market (e.g. Hanson and Santas, 2014 or Bricongne et al., 2019). This paper focuses on the sellers’ perspective (which is precisely what is achieved by real estate web-scraping, where the data are posted by the sellers, as opposed to final transaction data that result from the interaction between sellers and buyers) and derives indicators from their perspective. It covers the UK market in this unique period of Covid-19 and Brexit – although this approach can be transparently extended to other geographical areas.
Official statistics on residential real estate are relatively incomplete and available with a lag. In the United Kingdom, the main indicators (price indices, construction sector surveys, new build index, detailed transaction data, etc.) are generally published monthly, at least 10 to 15 days after the end of the month, or more depending on the source and type of data. This lag time is generally longer in most other OECD countries, which would make alternative statistics even more useful. Furthermore, in the UK, statistics are not always available at a very detailed sub-national level…
Download the PDF version of this document
- Published on 07/29/2021
- 7 pages
- EN
- PDF (282.87 KB)
Bulletin Banque de France 235
Updated on: 08/09/2021 12:35