
Missing Growth from Creative Destruction
Statistical agencies typically impute inflation for disappearing products based on surviving products, which may result in overstated inflation and understated growth. Using U.S. Census data, we apply two ways of assessing the magnitude of “missing growth” for private nonfarm businesses from 1983–2013. The first approach exploits information on the market share of surviving plants. The second approach applies indirect inference to firm-level data. We find: (i) missing growth from imputation is substantial — at least 0.6 percentage points per year; and (ii) most of the missing growth is due to creative destruction (as opposed to new varieties).
Whereas it is straightforward to compute inflation for an unchanging set of goods and services, it is much harder to separate inflation from quality improvements and variety expansion amidst a changing set of items. Back in 1996, the Boskin Commission increased awareness of potential biases in how the US Bureau of Labor Statistics accounts for new products in calculating the Consumer Price Index (CPI). In particular, the Commission challenged whether the Bureau of Labor Statistics accurately deals with products experiencing model changes by the same producer (e.g. successive years of a car model) and with completely new product varieties.
In this paper, we propose a method that deals with new product varieties but also, more importantly, with products that are subject to creative destruction. In doing so, we highlight and quantify an additional, overlooked source of bias that has to do with imputation – used by the Bureau of Labor Statistics as well as the statistical offices in most other OECD countries. Creative destruction implies that products exit the market because they are eclipsed by a better product sold by a new producer. Such forced exit is relatively frequent in the US. The standard procedure in such cases is to assume that the quality-adjusted inflation rate is the same as for other items in the same category that the statistical office can follow over time, i.e. products that are not subject to creative destruction. However, creative destruction implies that the new products enter the market because they have a lower quality-adjusted price. Our study tries to quantify the bias that arises from relying on imputation to measure US productivity growth in cases of creative destruction.
To characterize such missing growth, we develop a theoretical framework in which growth results from both incumbent and entrant innovations. Our model generates an explicit expression for how much TFP growth is missed when the statistical office resorts to imputation in the event of creative destruction. We apply this framework to establishment-level employment data on all non-farm businesses from the US Census to quantify missing growth in the US economy over the last three decades. We identify surviving incumbent products with surviving plants.
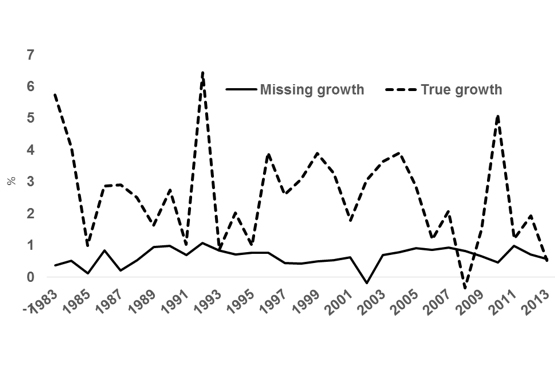
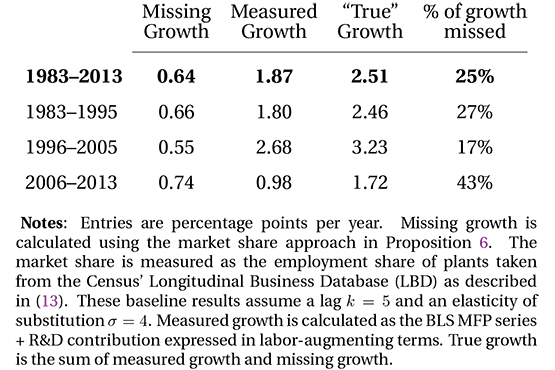
We estimate that missing growth averaged 0.62% per year from 1983 to 2013 as shown in the above figure. From this figure, we see no clear time trend in this bias. Missing growth amounts to roughly one-quarter of true growth on average. Furthermore, since missing growth is fairly stable over time, TFP growth still appears to have slowed in recent years. We also look at missing growth across sectors. The results imply that the majority of aggregate missing growth comes from retail and service industries (e.g. health care), rather than manufacturing.
Since we find no clear time trend in missing growth, the bias we quantify here cannot account for the measured slowdown in productivity growth. Why then should we care about the fairly constant missing growth of about 0.62% per year? Our main finding has a number of practical implications. First, it suggests ways statistical offices might improve their methodology. Second, factoring in missing growth, ideas are not becoming as hard to find as official statistics suggest. This has implications for the production of ideas and future growth as well as optimal growth policy. Third, the US Federal Reserve might consider adjusting its inflation target upward to get closer to achieving quality-adjusted price stability. Fourth, as stressed by the Boskin Commission, because US tax brackets and Social Security benefits are indexed to measured inflation, they would evolve differently if official inflation was lowered by 0.5% per year. Finally, although 0.5% per year looks small, over 30 years it accumulates to mean that a higher fraction of children enjoys a better quality of life than their parents.
Télécharger la version PDF du document

- Publié le 22/11/2017
- 42 page(s)
- EN
- PDF (2.05 Mo)
Mis à jour le : 22/11/2017 11:10